The graph of f', the derivative of f, is shown in the graph below. Given that f(-6) = 2, follow the instructions below in order to sketch the graph of f. Plot the initial value on the graph of f. Graph of f *82 6 5 10 Graph of f 12 10 10 8 7 9. 10 10
The graph of f', the derivative of f, is shown in the graph below. Given that f(-6) = 2, follow the instructions below in order to sketch the graph of f. Plot the initial value on the graph of f. Graph of f *82 6 5 10 Graph of f 12 10 10 8 7 9. 10 10

Trigonometry (MindTap Course List)
10th Edition
ISBN:9781337278461
Author:Ron Larson
Publisher:Ron Larson
ChapterP: Prerequisites
SectionP.6: Analyzing Graphs Of Functions
Problem 6ECP: Find the average rates of change of f(x)=x2+2x (a) from x1=3 to x2=2 and (b) from x1=2 to x2=0.

Related questions

Concept explainers
Rate of Change
The relation between two quantities which displays how much greater one quantity is than another is called ratio.
Slope
The change in the vertical distances is known as the rise and the change in the horizontal distances is known as the run. So, the rise divided by run is nothing but a slope value. It is calculated with simple algebraic equations as:
Question
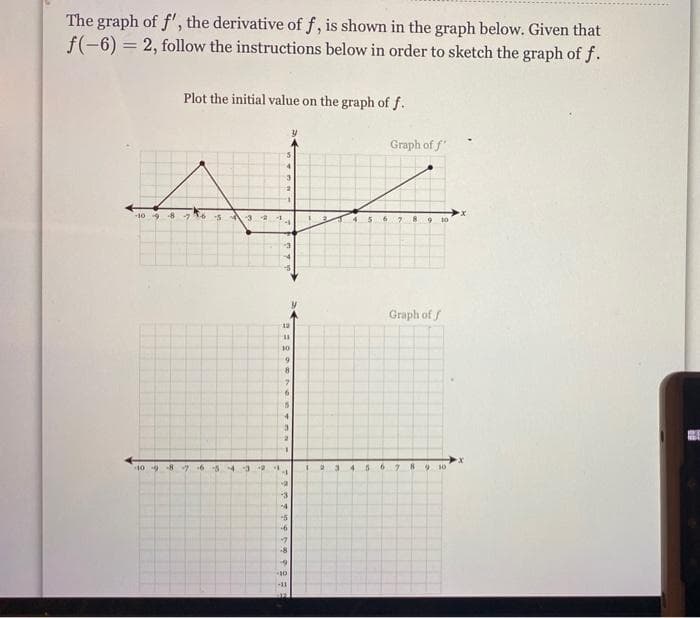
Transcribed Image Text:The graph of f', the derivative of f, is shown in the graph below. Given that
f(-6) = 2, follow the instructions below in order to sketch the graph of f.
Plot the initial value on the graph of f.
Graph of f'
4.
10 98 7
-3
4.
7.
10
Graph of f
12
10
109 8 76-5
4.
9.
30
-3
4
-5
Expert Solution
This question has been solved!
Explore an expertly crafted, step-by-step solution for a thorough understanding of key concepts.

This is a popular solution!

Trending now
This is a popular solution!

Step by step
Solved in 3 steps with 2 images

Knowledge Booster


Learn more about
Need a deep-dive on the concept behind this application? Look no further. Learn more about this topic, algebra and related others by exploring similar questions and additional content below.Recommended textbooks for you
Trigonometry (MindTap Course List)
Trigonometry
ISBN:
9781337278461
Author:
Ron Larson
Publisher:
Cengage Learning
Trigonometry (MindTap Course List)
Trigonometry
ISBN:
9781337278461
Author:
Ron Larson
Publisher:
Cengage Learning