The graph of f(x) is given in the figure below. Draw tangent lines to the graph at x = -1.x=0, x= 3, and x = 6. Estimate f'(-1) f' (0). f' (3), and f' (6). -8 -6-4-2 0 2 4 6 Round your answers to one decimal place. ƒ'(-1)= ƒ' (0) = ƒ' (3)= ƒ' (6)
The graph of f(x) is given in the figure below. Draw tangent lines to the graph at x = -1.x=0, x= 3, and x = 6. Estimate f'(-1) f' (0). f' (3), and f' (6). -8 -6-4-2 0 2 4 6 Round your answers to one decimal place. ƒ'(-1)= ƒ' (0) = ƒ' (3)= ƒ' (6)

Mathematics For Machine Technology
8th Edition
ISBN:9781337798310
Author:Peterson, John.
Publisher:Peterson, John.
Chapter58: Achievement Review—section Five
Section: Chapter Questions
Problem 30AR: Determine dimension x to 3 decimal places.

Related questions
Question
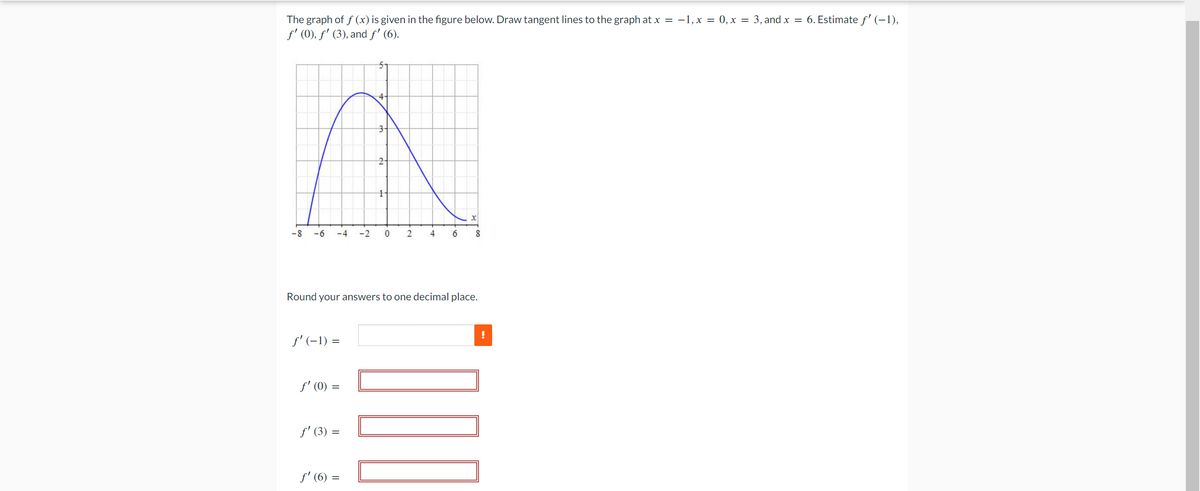
Transcribed Image Text:The graph of f(x) is given in the figure below. Draw tangent lines to the graph at x = -1, x = 0, x = 3, and x = 6. Estimate ƒ' (−1),
ƒ' (0), ƒ' (3), and ƒ' (6).
3-
A
2
1
-4 -2
0 2
-8
-6
ƒ' (-1) =
Round your answers to one decimal place.
ƒ' (0) =
ƒ' (3):
X
ƒ' (6) =
4 6 8
!
Expert Solution
This question has been solved!
Explore an expertly crafted, step-by-step solution for a thorough understanding of key concepts.

This is a popular solution!

Trending now
This is a popular solution!

Step by step
Solved in 3 steps with 8 images

Recommended textbooks for you
Mathematics For Machine Technology
Advanced Math
ISBN:
9781337798310
Author:
Peterson, John.
Publisher:
Cengage Learning,
Mathematics For Machine Technology
Advanced Math
ISBN:
9781337798310
Author:
Peterson, John.
Publisher:
Cengage Learning,