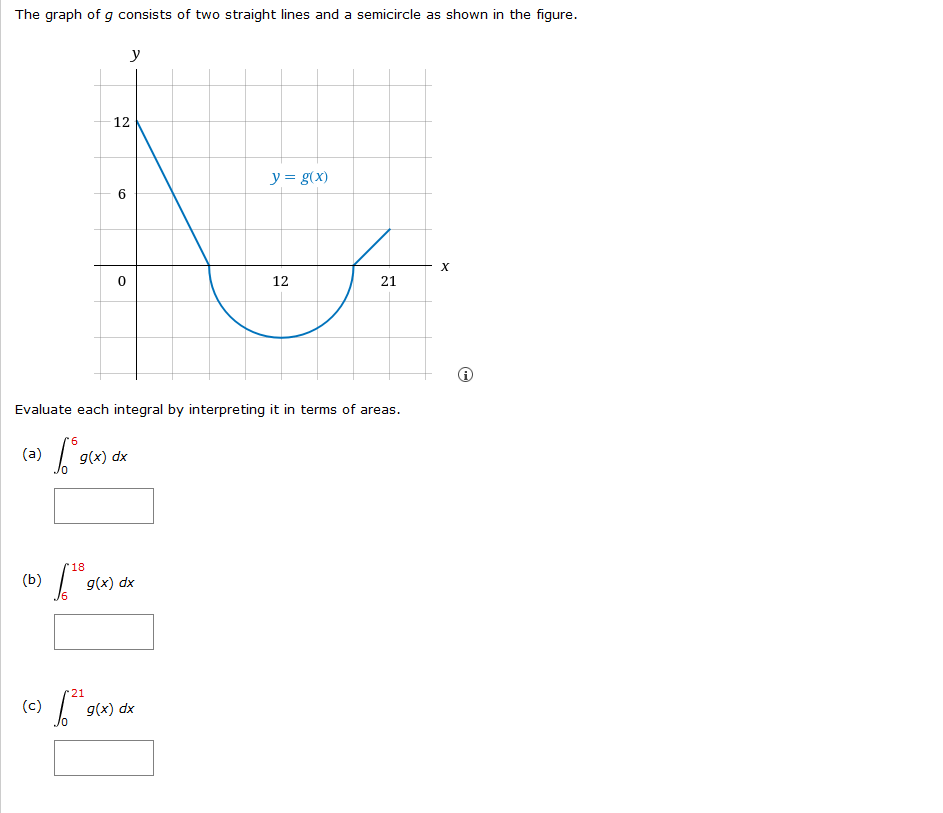
The graph of g consists of two straight lines and a semicircle as shown in the figure. y 12 y = g(x) 6. 12 21 Evaluate each integral by interpreting it in terms of areas. (a) g(x) dx '18 (b) g(x) dx (c) 21 g(x) dx
The graph of g consists of two straight lines and a semicircle as shown in the figure. y 12 y = g(x) 6. 12 21 Evaluate each integral by interpreting it in terms of areas. (a) g(x) dx '18 (b) g(x) dx (c) 21 g(x) dx

Functions and Change: A Modeling Approach to College Algebra (MindTap Course List)
6th Edition
ISBN:9781337111348
Author:Bruce Crauder, Benny Evans, Alan Noell
Publisher:Bruce Crauder, Benny Evans, Alan Noell
ChapterA: Appendix
SectionA.2: Geometric Constructions
Problem 10P: A soda can has a volume of 25 cubic inches. Let x denote its radius and h its height, both in...

Related questions
Question
100%
show me the steps , i want to understand it
Transcribed Image Text:The graph of g consists of two straight lines and a semicircle as shown in the figure.
y
12
y = g(x)
6.
12
21
Evaluate each integral by interpreting it in terms of areas.
(a)
g(x) dx
'18
(b)
g(x) dx
(c)
21
g(x) dx
Expert Solution
This question has been solved!
Explore an expertly crafted, step-by-step solution for a thorough understanding of key concepts.

This is a popular solution!

Trending now
This is a popular solution!

Step by step
Solved in 2 steps with 2 images

Knowledge Booster


Learn more about
Need a deep-dive on the concept behind this application? Look no further. Learn more about this topic, calculus and related others by exploring similar questions and additional content below.Recommended textbooks for you
Functions and Change: A Modeling Approach to Coll…
Algebra
ISBN:
9781337111348
Author:
Bruce Crauder, Benny Evans, Alan Noell
Publisher:
Cengage Learning
Functions and Change: A Modeling Approach to Coll…
Algebra
ISBN:
9781337111348
Author:
Bruce Crauder, Benny Evans, Alan Noell
Publisher:
Cengage Learning