The graph of the accompanying figure shows the average annual percentage change y = f(t) in a particular country's gross national product (GNP) for the years 1985-1990. dy Choose the correct graph of dt %3D O A. B. Ay (%) 10- ^y' 10- 10- 8- 1990 1985 1990 64 -10- -10- 4- OC. D. 2- ^У 10- 10- 0+ 1985 1986 1987 1988 1990 1989 Year 1985 1985 1990 1990 -10- -10-
The graph of the accompanying figure shows the average annual percentage change y = f(t) in a particular country's gross national product (GNP) for the years 1985-1990. dy Choose the correct graph of dt %3D O A. B. Ay (%) 10- ^y' 10- 10- 8- 1990 1985 1990 64 -10- -10- 4- OC. D. 2- ^У 10- 10- 0+ 1985 1986 1987 1988 1990 1989 Year 1985 1985 1990 1990 -10- -10-

Linear Algebra: A Modern Introduction
4th Edition
ISBN:9781285463247
Author:David Poole
Publisher:David Poole
Chapter6: Vector Spaces
Section6.7: Applications
Problem 16EQ

Related questions
Topic Video
Question
Can i get help step by step please
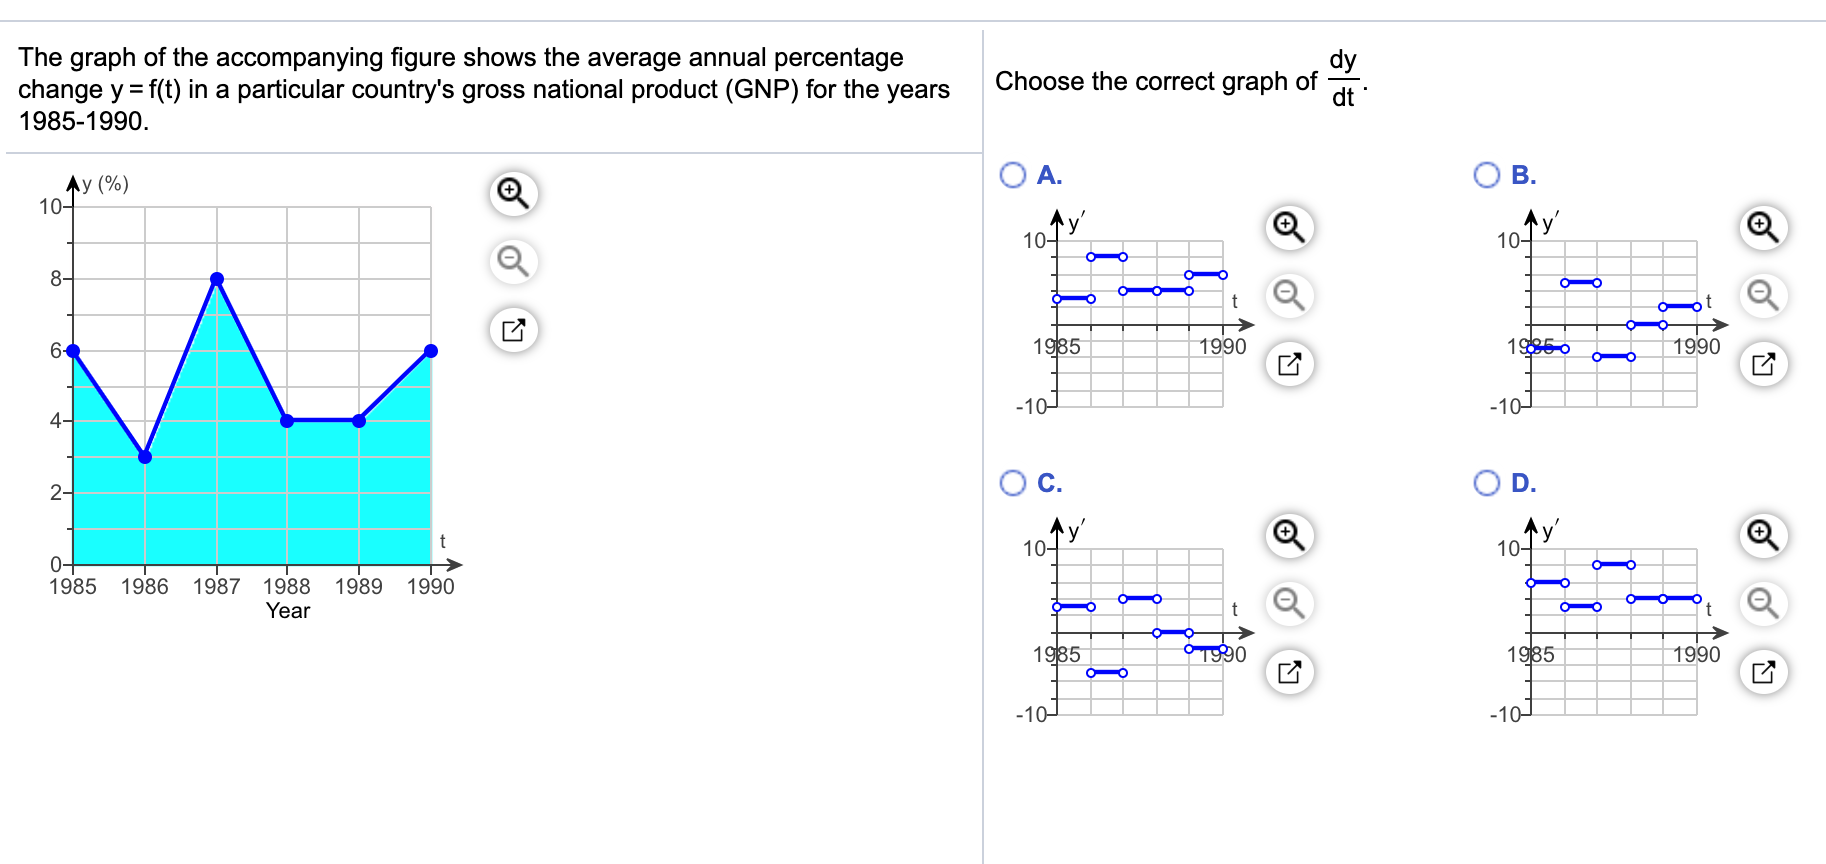
Transcribed Image Text:The graph of the accompanying figure shows the average annual percentage
change y = f(t) in a particular country's gross national product (GNP) for the years
1985-1990.
dy
Choose the correct graph of
dt
%3D
O A.
B.
Ay (%)
10-
^y'
10-
10-
8-
1990
1985
1990
64
-10-
-10-
4-
OC.
D.
2-
^У
10-
10-
0+
1985 1986 1987 1988
1990
1989
Year
1985
1985
1990
1990
-10-
-10-
Expert Solution
This question has been solved!
Explore an expertly crafted, step-by-step solution for a thorough understanding of key concepts.

This is a popular solution!

Trending now
This is a popular solution!

Step by step
Solved in 4 steps with 2 images

Knowledge Booster


Learn more about
Need a deep-dive on the concept behind this application? Look no further. Learn more about this topic, calculus and related others by exploring similar questions and additional content below.Recommended textbooks for you
Linear Algebra: A Modern Introduction
Algebra
ISBN:
9781285463247
Author:
David Poole
Publisher:
Cengage Learning
Linear Algebra: A Modern Introduction
Algebra
ISBN:
9781285463247
Author:
David Poole
Publisher:
Cengage Learning