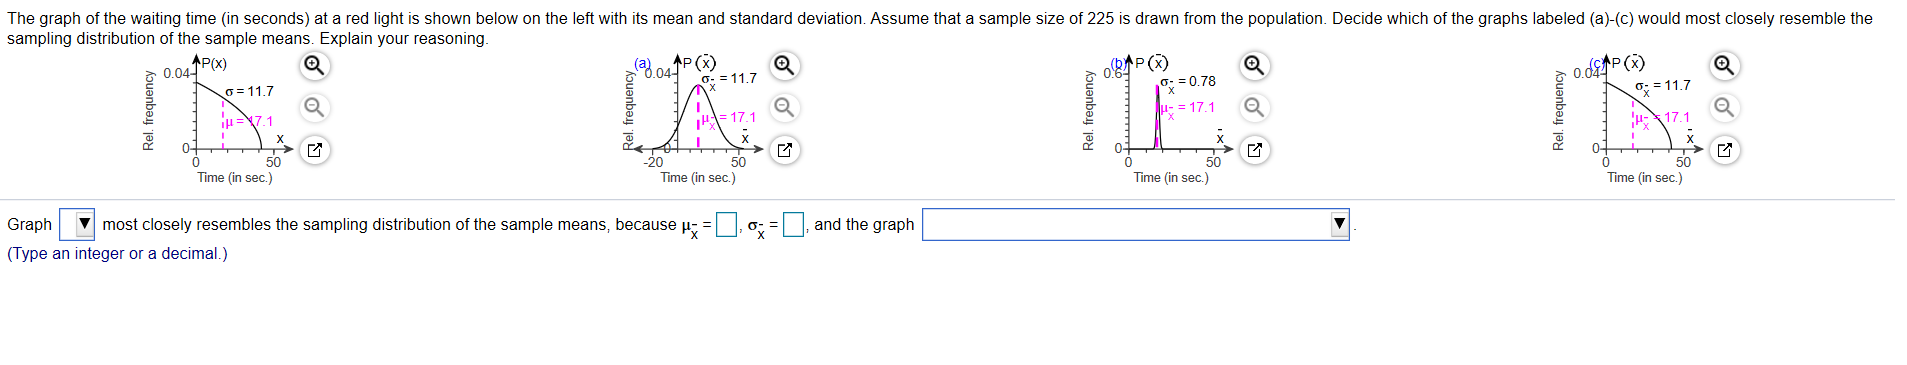
The graph of the waiting time (in seconds) at a red light is shown below on the left with its mean and standard deviation. Assume that a sample size of 225 is drawn from the population. Decide which of the graphs labeled (a)-(c) would most closely resemble the sampling distribution of the sample means. Explain your reasoning. AP(X) 0.04- (a) o P(x) 6.04- 0. = 11.7 ogP() 0: =0.78 o.dsP() o; = 11.7 6=11.7 i=7.1 = 17.1 u- = 17.1 0- H17.1 50 Time (in sec.) Time (in sec.) 0- 50 Time (in sec.) Time (in sec.) Graph most closely resembles the sampling distribution of the sample means, because p: and the graph (Type an integer or a decimal.) Rel. frequency Rel. frequency O 包 Rel. frequency
The graph of the waiting time (in seconds) at a red light is shown below on the left with its mean and standard deviation. Assume that a sample size of 225 is drawn from the population. Decide which of the graphs labeled (a)-(c) would most closely resemble the sampling distribution of the sample means. Explain your reasoning. AP(X) 0.04- (a) o P(x) 6.04- 0. = 11.7 ogP() 0: =0.78 o.dsP() o; = 11.7 6=11.7 i=7.1 = 17.1 u- = 17.1 0- H17.1 50 Time (in sec.) Time (in sec.) 0- 50 Time (in sec.) Time (in sec.) Graph most closely resembles the sampling distribution of the sample means, because p: and the graph (Type an integer or a decimal.) Rel. frequency Rel. frequency O 包 Rel. frequency

Glencoe Algebra 1, Student Edition, 9780079039897, 0079039898, 2018
18th Edition
ISBN:9780079039897
Author:Carter
Publisher:Carter
Chapter10: Statistics
Section10.3: Measures Of Spread
Problem 26PFA

Related questions

Concept explainers
Contingency Table
A contingency table can be defined as the visual representation of the relationship between two or more categorical variables that can be evaluated and registered. It is a categorical version of the scatterplot, which is used to investigate the linear relationship between two variables. A contingency table is indeed a type of frequency distribution table that displays two variables at the same time.
Binomial Distribution
Binomial is an algebraic expression of the sum or the difference of two terms. Before knowing about binomial distribution, we must know about the binomial theorem.
Topic Video
Question
Transcribed Image Text:The graph of the waiting time (in seconds) at a red light is shown below on the left with its mean and standard deviation. Assume that a sample size of 225 is drawn from the population. Decide which of the graphs labeled (a)-(c) would most closely resemble the
sampling distribution of the sample means. Explain your reasoning.
AP(X)
0.04-
(a) o P(x)
6.04-
0. = 11.7
ogP()
0: =0.78
o.dsP()
o; = 11.7
6=11.7
i=7.1
= 17.1
u- = 17.1
0-
H17.1
50
Time (in sec.)
Time (in sec.)
0-
50
Time (in sec.)
Time (in sec.)
Graph
most closely resembles the sampling distribution of the sample means, because p:
and the graph
(Type an integer or a decimal.)
Rel. frequency
Rel. frequency
O 包
Rel. frequency
Expert Solution
This question has been solved!
Explore an expertly crafted, step-by-step solution for a thorough understanding of key concepts.

This is a popular solution!

Trending now
This is a popular solution!

Step by step
Solved in 2 steps with 3 images

Knowledge Booster


Learn more about
Need a deep-dive on the concept behind this application? Look no further. Learn more about this topic, statistics and related others by exploring similar questions and additional content below.Recommended textbooks for you
Glencoe Algebra 1, Student Edition, 9780079039897…
Algebra
ISBN:
9780079039897
Author:
Carter
Publisher:
McGraw Hill
Glencoe Algebra 1, Student Edition, 9780079039897…
Algebra
ISBN:
9780079039897
Author:
Carter
Publisher:
McGraw Hill