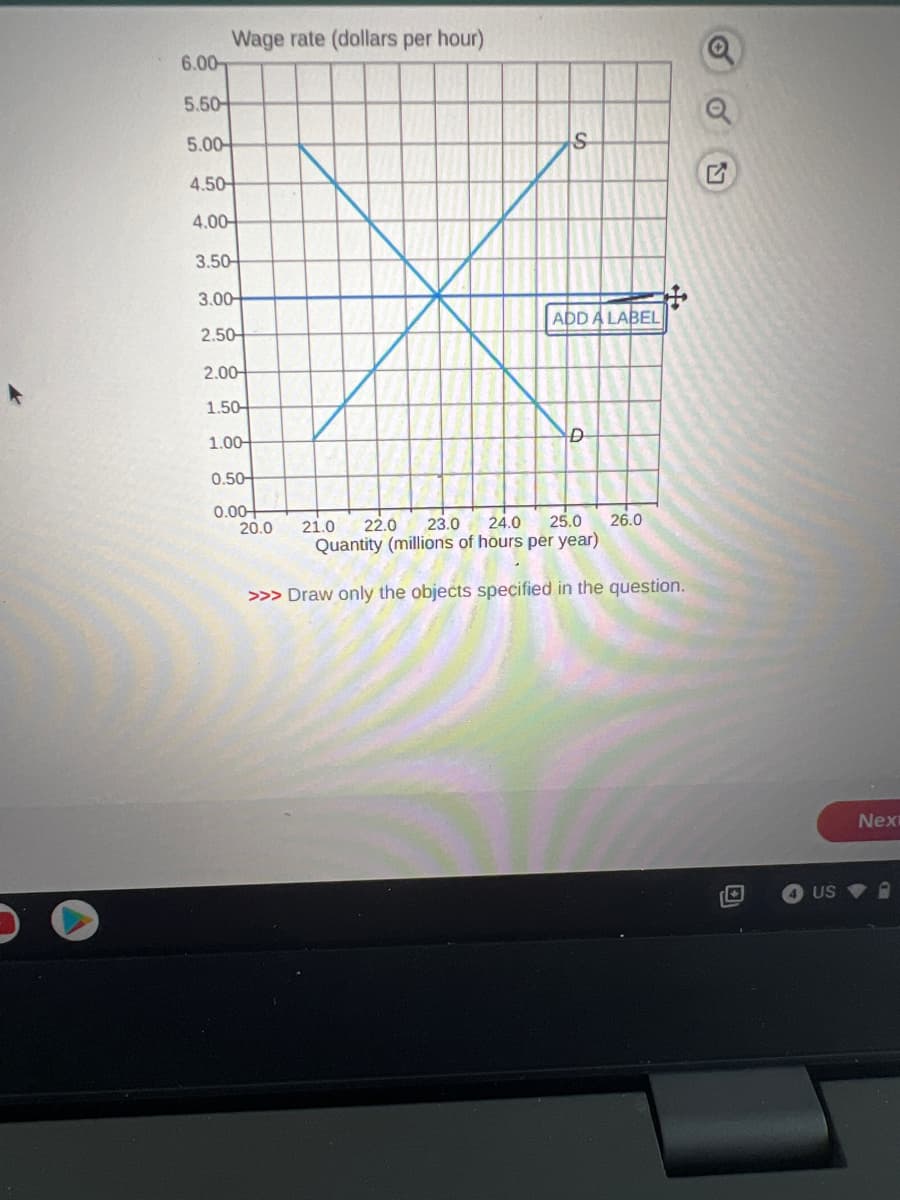
The graph shows a market for labor. Draw a line that illustrates a minimum wage that creates unemployment of 3 million hours a year. Label it. A minimum wage is a O A. quantity ceiling B. price ceiling C. quantity floor OD. price floor applied to labor markets. ***
The graph shows a market for labor. Draw a line that illustrates a minimum wage that creates unemployment of 3 million hours a year. Label it. A minimum wage is a O A. quantity ceiling B. price ceiling C. quantity floor OD. price floor applied to labor markets. ***

Principles of Economics 2e
2nd Edition
ISBN:9781947172364
Author:Steven A. Greenlaw; David Shapiro
Publisher:Steven A. Greenlaw; David Shapiro
Chapter4: Labor And Financial Markets
Section: Chapter Questions
Problem 20RQ: Whether the product market or the labor market, what happens to line equilibrium price and quantity...

Related questions
Question
Transcribed Image Text:6.00
5.50
5.00
Wage rate (dollars per hour)
4.50
4.00
3.50-
3.00
2.50
2.00
1.50-
1.00
0.50
0.00
20.0 21.0 22.0 23.0 24.0 25.0 26.0
Quantity (millions of hours per year)
>>> Draw only the objects specified in the question.
ADD A LABEL
D
of.
G
4 US
Nex

Transcribed Image Text:The graph shows a market for labor.
Draw a line that illustrates a minimum wage that creates unemployment of 3 million hours a year. Label it.
A minimum wage is a
OA. quantity ceiling
OB. price ceiling
OC. quantity floor
OD. price floor
esc
applied to labor markets.
2
→
#
3
с
$
4
%
5
6
<
Expert Solution
This question has been solved!
Explore an expertly crafted, step-by-step solution for a thorough understanding of key concepts.

This is a popular solution!

Trending now
This is a popular solution!

Step by step
Solved in 3 steps with 1 images

Knowledge Booster


Learn more about
Need a deep-dive on the concept behind this application? Look no further. Learn more about this topic, economics and related others by exploring similar questions and additional content below.Recommended textbooks for you
Principles of Economics 2e
Economics
ISBN:
9781947172364
Author:
Steven A. Greenlaw; David Shapiro
Publisher:
OpenStax


Principles of Economics 2e
Economics
ISBN:
9781947172364
Author:
Steven A. Greenlaw; David Shapiro
Publisher:
OpenStax


Essentials of Economics (MindTap Course List)
Economics
ISBN:
9781337091992
Author:
N. Gregory Mankiw
Publisher:
Cengage Learning