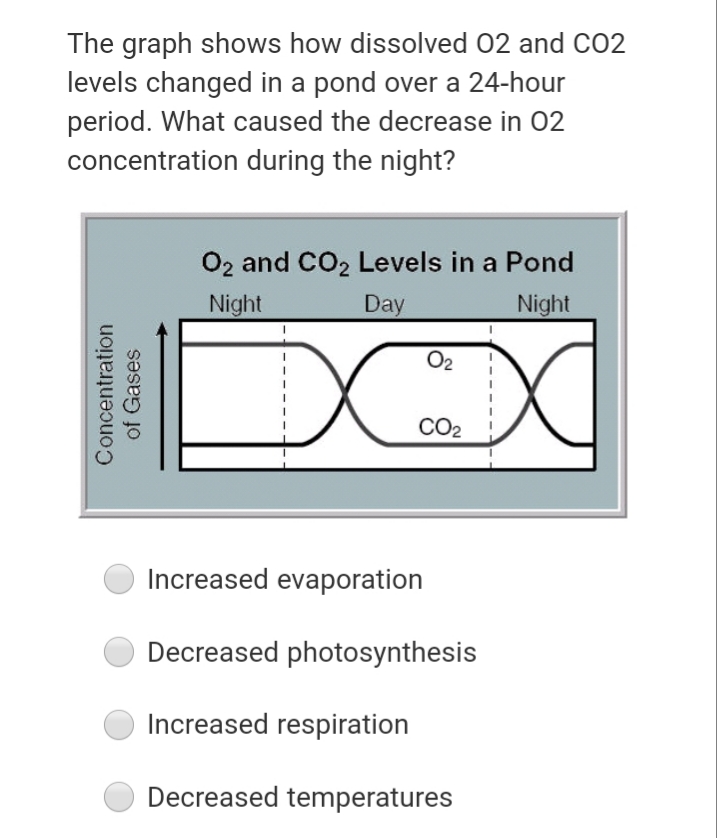
The graph shows how dissolved 02 and CO2 levels changed in a pond over a 24-hour period. What caused the decrease in 02 concentration during the night?
The graph shows how dissolved 02 and CO2 levels changed in a pond over a 24-hour period. What caused the decrease in 02 concentration during the night?

Biology (MindTap Course List)
11th Edition
ISBN:9781337392938
Author:Eldra Solomon, Charles Martin, Diana W. Martin, Linda R. Berg
Publisher:Eldra Solomon, Charles Martin, Diana W. Martin, Linda R. Berg
Chapter55: Ecosystems And The Biosphere
Section: Chapter Questions
Problem 9TYU: Test Your Understanding 9. Which of the following processes is not directly involved in the...

Related questions
Question
I need help
Transcribed Image Text:The graph shows how dissolved 02 and CO2
levels changed in a pond over a 24-hour
period. What caused the decrease in 02
concentration during the night?
O2 and CO2 Levels in a Pond
Night
Day
Night
O2
CO2
Increased evaporation
Decreased photosynthesis
Increased respiration
Decreased temperatures
Concentration
of Gases
Expert Solution
This question has been solved!
Explore an expertly crafted, step-by-step solution for a thorough understanding of key concepts.

This is a popular solution!

Trending now
This is a popular solution!

Step by step
Solved in 2 steps

Knowledge Booster


Learn more about
Need a deep-dive on the concept behind this application? Look no further. Learn more about this topic, biology and related others by exploring similar questions and additional content below.Recommended textbooks for you
Biology (MindTap Course List)
Biology
ISBN:
9781337392938
Author:
Eldra Solomon, Charles Martin, Diana W. Martin, Linda R. Berg
Publisher:
Cengage Learning

Biology Today and Tomorrow without Physiology (Mi…
Biology
ISBN:
9781305117396
Author:
Cecie Starr, Christine Evers, Lisa Starr
Publisher:
Cengage Learning

Biology (MindTap Course List)
Biology
ISBN:
9781337392938
Author:
Eldra Solomon, Charles Martin, Diana W. Martin, Linda R. Berg
Publisher:
Cengage Learning
Biology Today and Tomorrow without Physiology (Mi…
Biology
ISBN:
9781305117396
Author:
Cecie Starr, Christine Evers, Lisa Starr
Publisher:
Cengage Learning