Scientists tested the temperature of a community swimming pool every hour for 10 hours. The scatterplot shows the temperatures they recorded. The scientists calculated a line of best fit between the data points. Hourly Temperature of Water in a Swimming Pool 27 26 25 24 22 21 20 19 18 17 1 2 3 4 5 6 7 8 9 10 Time (hr) How will scientists most likely use the line of best fit from the graph? to predict water temperatures at all times of the day to predict the maximum water temperature the swimming pool water can reach to determine the time of day when the highest water temperature of the water was reached Temperature (°C)
Scientists tested the temperature of a community swimming pool every hour for 10 hours. The scatterplot shows the temperatures they recorded. The scientists calculated a line of best fit between the data points. Hourly Temperature of Water in a Swimming Pool 27 26 25 24 22 21 20 19 18 17 1 2 3 4 5 6 7 8 9 10 Time (hr) How will scientists most likely use the line of best fit from the graph? to predict water temperatures at all times of the day to predict the maximum water temperature the swimming pool water can reach to determine the time of day when the highest water temperature of the water was reached Temperature (°C)

Human Anatomy & Physiology (11th Edition)
11th Edition
ISBN:9780134580999
Author:Elaine N. Marieb, Katja N. Hoehn
Publisher:Elaine N. Marieb, Katja N. Hoehn
Chapter1: The Human Body: An Orientation
Section: Chapter Questions
Problem 1RQ: The correct sequence of levels forming the structural hierarchy is A. (a) organ, organ system,...

Related questions

Question
Answer the question
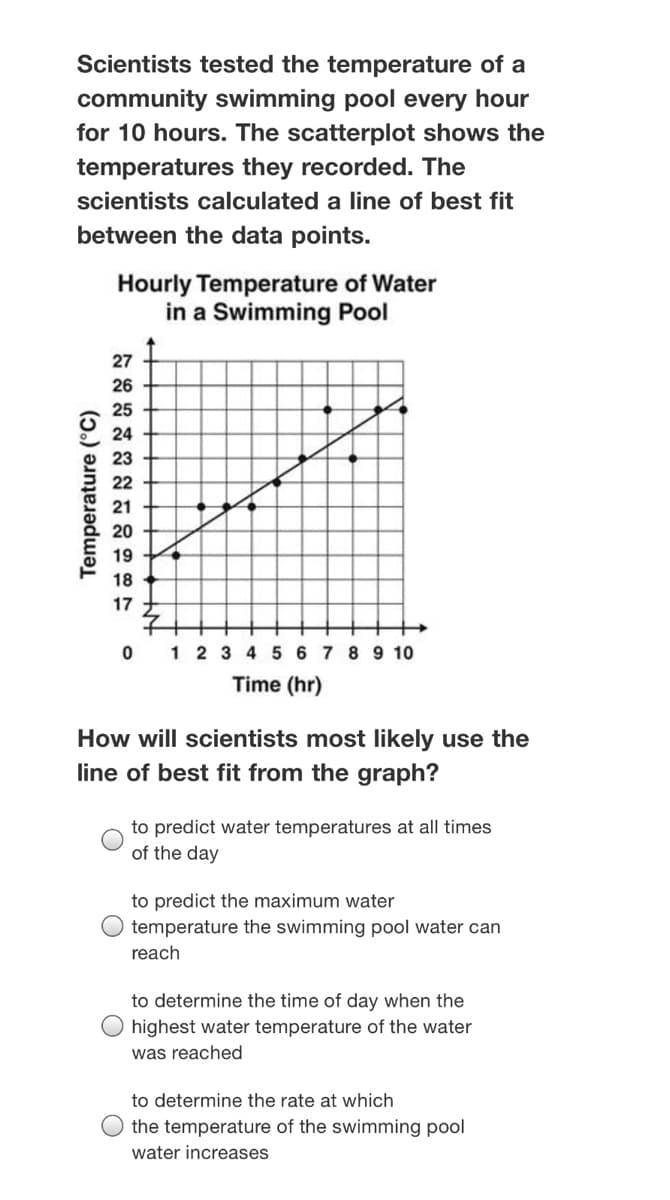
Transcribed Image Text:Scientists tested the temperature of a
community swimming pool every hour
for 10 hours. The scatterplot shows the
temperatures they recorded. The
scientists calculated a line of best fit
between the data points.
Hourly Temperature of Water
in a Swimming Pool
27
26
25
24
23
22
21
20
19
18
17
1 2 3 4 5 6 7 8 9 10
Time (hr)
How will scientists most likely use the
line of best fit from the graph?
to predict water temperatures at all times
of the day
to predict the maximum water
temperature the swimming pool water can
reach
to determine the time of day when the
highest water temperature of the water
was reached
to determine the rate at which
the temperature of the swimming pool
water increases
Temperature (°C)
Expert Solution
This question has been solved!
Explore an expertly crafted, step-by-step solution for a thorough understanding of key concepts.

This is a popular solution!

Trending now
This is a popular solution!

Step by step
Solved in 2 steps

Knowledge Booster


Learn more about
Need a deep-dive on the concept behind this application? Look no further. Learn more about this topic, biology and related others by exploring similar questions and additional content below.Recommended textbooks for you
Human Anatomy & Physiology (11th Edition)
Biology
ISBN:
9780134580999
Author:
Elaine N. Marieb, Katja N. Hoehn
Publisher:
PEARSON

Biology 2e
Biology
ISBN:
9781947172517
Author:
Matthew Douglas, Jung Choi, Mary Ann Clark
Publisher:
OpenStax

Anatomy & Physiology
Biology
ISBN:
9781259398629
Author:
McKinley, Michael P., O'loughlin, Valerie Dean, Bidle, Theresa Stouter
Publisher:
Mcgraw Hill Education,
Human Anatomy & Physiology (11th Edition)
Biology
ISBN:
9780134580999
Author:
Elaine N. Marieb, Katja N. Hoehn
Publisher:
PEARSON
Biology 2e
Biology
ISBN:
9781947172517
Author:
Matthew Douglas, Jung Choi, Mary Ann Clark
Publisher:
OpenStax
Anatomy & Physiology
Biology
ISBN:
9781259398629
Author:
McKinley, Michael P., O'loughlin, Valerie Dean, Bidle, Theresa Stouter
Publisher:
Mcgraw Hill Education,

Molecular Biology of the Cell (Sixth Edition)
Biology
ISBN:
9780815344322
Author:
Bruce Alberts, Alexander D. Johnson, Julian Lewis, David Morgan, Martin Raff, Keith Roberts, Peter Walter
Publisher:
W. W. Norton & Company

Laboratory Manual For Human Anatomy & Physiology
Biology
ISBN:
9781260159363
Author:
Martin, Terry R., Prentice-craver, Cynthia
Publisher:
McGraw-Hill Publishing Co.

Inquiry Into Life (16th Edition)
Biology
ISBN:
9781260231700
Author:
Sylvia S. Mader, Michael Windelspecht
Publisher:
McGraw Hill Education