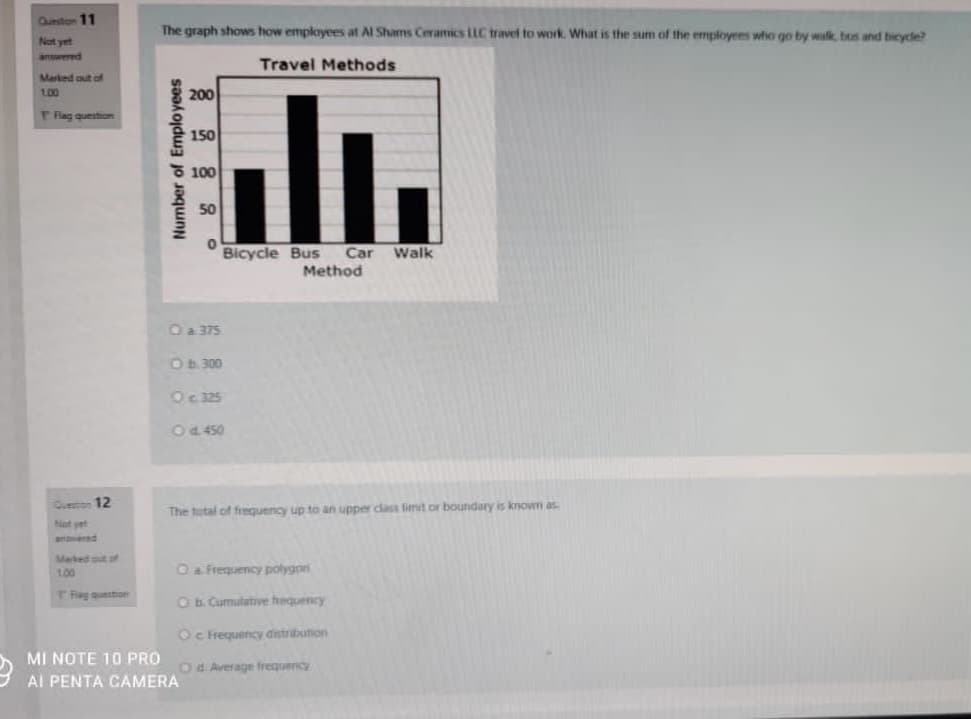
The graph shows how employees at Al Shams Ceramics LLC travel to work. What is the sum of the employees who go by walk, bos and bicycle Travel Methods 200 150 100 50 Bicycle Bus Car Walk Method Number of Employees


Q: Which graph represents only numbers less than – 2? - A -2 B C -2 D -2
A: In the number line, the number to the left of the zero are the negative numbers and the numbers to…
Q: TrueFun Entertainment sells four types of products: DVDS, video games, radios, and CDs. The numbers…
A:
Q: The line graph below shows the number of times Maria drove her car each day of the week. 9. Day of…
A: Given graph is frequency polygon . A frequency polygon is a graph constructed by using lines to join…
Q: 2. Tell one Solution to this graph. 1.
A: topic- inequality
Q: In the graph below determine whether the following graphs are paths, simple paths, circuits, or…
A: According to the given information, it is required to determine whether the following graph are…
Q: If a complete graph has 6 vertices, then the number of edges are ______ a. 10 b. 15…
A:
Q: graph, answer the questions. Number of T-shirts Sold 12- 10- 8- 6- 4- 2- red white blue Color black…
A: Graphs are used for easy understanding. It used to visualize the data set. Each graphs are used for…
Q: TrueFun Entertainment sells four types of products: CDs, radios, DVDS, and video games. The numbers…
A: Given, The number of four products sold in 2019 and 2020 are given in double bar diagram.
Q: John charges $250 to cut people's grass and cuts the grass 4 times a month. On a graph how much…
A: John charges=$ 250 Cuts the grass 4 times a month.
Q: Graph each union or intersection. x - y 4
A: Given two inequalities x - y < 3 and x > 4
Q: Number of New Passengers 7 5 3 0 1 2 3 4 5 6 7 8 Stop Number Number of Passengers 2.
A:
Q: Select the graph that would represent the best presentation of the solution set. 4а — 2 < 10 - -4 -3…
A: Given: 4x-2<10 First simplify the given inequality by adding 2 to each sides and then solve for x…
Q: Which graph shows a line that contains the points in the table of ordered pairs Ax) -2 -1 1 2 3 4 5…
A: We need to draw graph using given table
Q: Graph the intersection of x−y3.
A:
Q: The graphs labeled (a)–(d) in the given figure represent y = 3x, y = 5x, y = (1/3)x, and y = (1/5)x,…
A: given: the four graphs of the function are given. the functions are: y=3xy=5xy=13x=3-xy=15x=5-x
Q: The bar graph shows the average number of years a group of people devoted to their most…
A: Number of years spent for working and eating = 25 years. given that years spent on working will…
Q: In the graph below, determine whether the following walks are trails, 10. paths, closed walk,…
A:
Q: 51. The graph and table below show infor Landscaping Company A Landscaping Company B y Time Spent…
A: We will solve the following.
Q: 3. What do the numbers in the vertical axis of the graph represent?
A: No other information is given except the questions. The numbers on the vertical axis i.e. the…
Q: Draw a graph for y=3/4 + 7 =
A: Topic:- geometry
Q: n a graph, if the sum of the degree of all the vertices is 18, then the number of edges are _______…
A: Given: To explain the correct option of the given statement as follows,
Q: Determine the equation of the midline of the following graph. 4 AVA 1 5T 257 107 3 3 2 -2 -3 -4 -5…
A:
Q: Look at the diagram. S.
A: The given figure is:
Q: In the graph below, there are four translators who can speak 2 languages each (3 if you include…
A: Given is a graph showing that there are four translators who speak 2 languages. Now, a company has…
Q: The line graph below shows the number of times Maria drove her car each day of the week. 4 2 2 4 Day…
A: From the provided information (graph), Corresponding to day 4, the number of times Maria drive her…
Q: The table lists the number of members at a local gym for selected years, where year 11 represents…
A:
Q: Which pair of graphs are equivalent? A. В. C. D. D
A: To find which pair of graphs are equivalent: Equivalent graphs: Two graphs are equivalent if…
Q: (b) Explain why the total degree of a graph is twice the number of its edges.
A: In this question we have to prove that sum of degrees of vertices of a graph is twice the number of…
Q: In a graph number of vertices are 13 and number of edges are 19, what will be the number of regions…
A: From Euler's formula we know that r = e - v +2 where r is number of regions, e is number of edges…
Q: In the graph "Fewer than half of black adults are now employed" it states that 48.8% of black adults…
A: Given, 48.8% of population 43,984,096 is employed. To find population which is employed and…
Q: Day Snow Depth (inches) 1 47 29 3. 20 4 10 7. 6. 1.5
A: We will check the how the entries are related. By dividing 1st term by 2nd term. In exponential…
Q: Which graph represents x ≥ 3?
A: We have to check which graph represents x ≥ 3
Q: Two plumbing companies charge money for each hour of work, plus a one-time fee. A Plus Plumbing…
A: To find: The compony that is cheaper to hire for 2 hours. Calculation: Assume the linear equation…
Q: Two plumbing companies charge money for each hour of work, plus a one-time fee. OPlus Plumbing…
A:
Q: Graph r -2. + -5 -4 -3 -2 -1 0 1 + +++ 3 4 5
A:
Q: The table at the right shows the times and tasks that must be completed to create a school's…
A:
Q: Andre earns $5200 a month at his new job. In order to track his spending and saving, he created a…
A:
Q: graph 5 - 4- 2- 2 3 4 5 ó 7 8 9 10 Use the graph to estimate the solution to 1.2" = 2 3.
A:
Q: If the sum of the degrees of vertices of graph G is 36, how many edges does G have? a. 12 b. 24…
A: We will use the theorem that the sum of the degree of graph G is equal to twice of number of edges.
Q: Give three observations that can be made from the graph. Site V has the most users. Monthly Active…
A:
Q: The following bar graph shows the profits or losses for a small retail store in its first year of…
A: It is an important application of statistics . Learning from the data as well as the diagrams is…
Q: Aiden asked a group of students to choose their favorite type of music from the choices of rock,…
A: Given: Rock: 20 students Hip Hop : 40 students Country: 30 students
Q: Use the graph to answer 1 and 2
A:
Q: Ms. Cameron was making a table of a linear pattern, but she got interrupted by a fire drill.…
A: Given that, Ms. Cameron was making a table of a linear pattern, but she got interrupted by a fire…
Q: The following is the graph of: 十- 2元 2元 3 2 3 2. R一6 R一3
A:
Q: TrueFun Entertainment sells four types of products: radios, video games, CDs, and DVDS. The numbers…
A: Solution
Q: Graph each set. (a) (1,3) ⋂ [2,7] (b) (1,3) ⋃ [2,7]
A: We have to graph each set on a number line.a) 1,3∩2,7From the plot we can see that the intersection…
Q: 2. Tell one Solution to this graph..
A: Given query is to find the solution of the graph.
Q: The number of frisbees in stock at the store and the number of customers purchasing the fRisbees is…
A: topic - grqphs
Q: Graph and show 4,x>1 points
A: Topic:- function

Step by step
Solved in 2 steps


- Former pro football star O.J. Simpson was accused of murdering his wife. In the trial, a defense attorney pointed out that although Simpson had been guilty of earlier spousal abuse, annually only about 40 women are murdered by their partner per 100,000 incidents of partner abuse. But this was misleading. Every year it is estimated that about 5 of every 100,000 women in the US who suffer partner abuse are killed by someone other than their partner. Draw a tree diagram for women who suffer partner abuse. Calculate the following (round to 5 decimal places):a) What is the probability that a woman who suffers partner abuse will be murdered by their partner?b) What is the probability that a woman who suffers partner abuse will be murdered (by anyone)?c) What is the probability that a murdered woman who suffered partner abuse was murdered by their partner?1. Melvin has a list of 5 salespeople and the dollar values for each of their 17 sales for the month of January. Which would be the best graph that would allow Melvin to compare the distributions of the dollar values of the 17 sales for each of the 5 salespeople for the month of January. 2. Melvin has a list of 5 salespeople and the 17 dollar values for each of their sales for the month of January. Which would be the best graph that would allow Melvin to evaluate the distribution of all of the 85 sale's dollar values for all of the sales people for the month of January. 3. Chance paid $2,073.90 in Social Security Tax last year. If Social Security tax is $6.20 tax per $100 earned, what was Chance's annual income last year?SOLVE STEP BY STEP AND MAKE VENN DIAGRAMS TOO In a manufacturing company, it was detected that an order of 240 pieces has quality problems. In order to determine in which operation the greatest number of defective parts was produced, an investigation was carried out and the following was found:• 70 pieces are assembled.• 90 pieces are baked.• 70 pieces are painted.• 130 pieces are baked or assembled.• 130 pieces are baked or painted.• 120 pieces are assembled or painted• 20 pieces are assembled and baked, but not painted. Determine the number of pieces according to the following propositions: i. They only went through the baking operation.ii. They did not undergo any of those operations.iii. They went through all three operations.iv. They passed the painting operation.
- V:55) Suppose G1 = ER1(3,0.5) and G2 = ER2(3,0.5) are two ER random graphs. What is the probability that they are isomorphic graphs?1. A recent survey of INTO Newcastle University students showed that 65% own aniPhone, 75% have a Casio fx-83 calculator and 10% have neither.a. Find the percentage of students who have both an iPhone and a calculator. b. In the space below, draw a Venn Diagram to represent this information.From time to time, the UTM Human Resource (UTMHR) department observes various employees fortheir work productivity. Recently UTMHR wanted to check whether the four employees at theDepartment XYZ counters, serve on average the same number of customers per hour. The HR managerobserved each of the four employees for a certain number of hours. The following Table 5 gives thenumber of customers served by the four employees during each of the observed hours. employee a employee b employee c employee d 19 14 11 24 21 16 14 19 26 14 21 21 24 13 13 26 18 17 16 20 employee a employee b employee c employee d mean 21.6 14.8 15.0 22.0 s 3.4 ? 3.8 ? c) Find variance between sample,d) Find variance within sample, e) Calculate the test statistic, F.f) Determine the numerator and denominator.g) Find the critical value of F at the 5% significance level, and test the claim that the mean numberof customers served per hour by each of these four employees is…
- From time to time, the UTM Human Resource (UTMHR) department observes various employees fortheir work productivity. Recently UTMHR wanted to check whether the four employees at theDepartment XYZ counters, serve on average the same number of customers per hour. The HR managerobserved each of the four employees for a certain number of hours. The following Table 5 gives thenumber of customers served by the four employees during each of the observed hours. employee a employee b employee c employee d 19 14 11 24 21 16 14 19 26 14 21 21 24 13 13 26 18 17 16 20 a) Define the hypothesis null, H0 and hypothesis alternative, H1.b) Given below are means and standard deviation for some of the employees. Calculate thestandard deviation for Employee B and D.a pollster wnats to minimize the effect the order of the questions has on a person's response to a survey. how many different surveys are required to cover all possible arrangements if there are 9 questions on the survey?the numbers provided are from randomly selected 18 beekeepers from the area and counted the number of hives infested with mites out of 10 randomly selected hives per beekeeper. The numbers of infestations for each beekeeper are 5, 2, 4, 3, 5, 0, 2, 3, 2, 1, 2, 3, 6, 0, 3, 5, 7, 4 create a freq table/graph
- For each problem, write which test you used in your calculator, draw the graph, calculate pvalue, and write your conclusion in a complete sentence.Mars Inc., makers of M&M candies, claims that they produce M&Ms with the following color distribution: Brown: 30% Red: 20% Yellow: 20% Orange: 10% Green: 10% Blue 10% A SRS of M&Ms bags were selected from the grocery store shelf and produced the following color counts: Brown: 120 Red: 57 Yellow: 63 Orange: 42 Green: 27 Blue: 21 Conduct a hypothesis test to see if the manufacturer’s claim for the proportion of orange M&Ms is correct.find the mximum possible order of S5Would you please draw a graph showing the right sequency