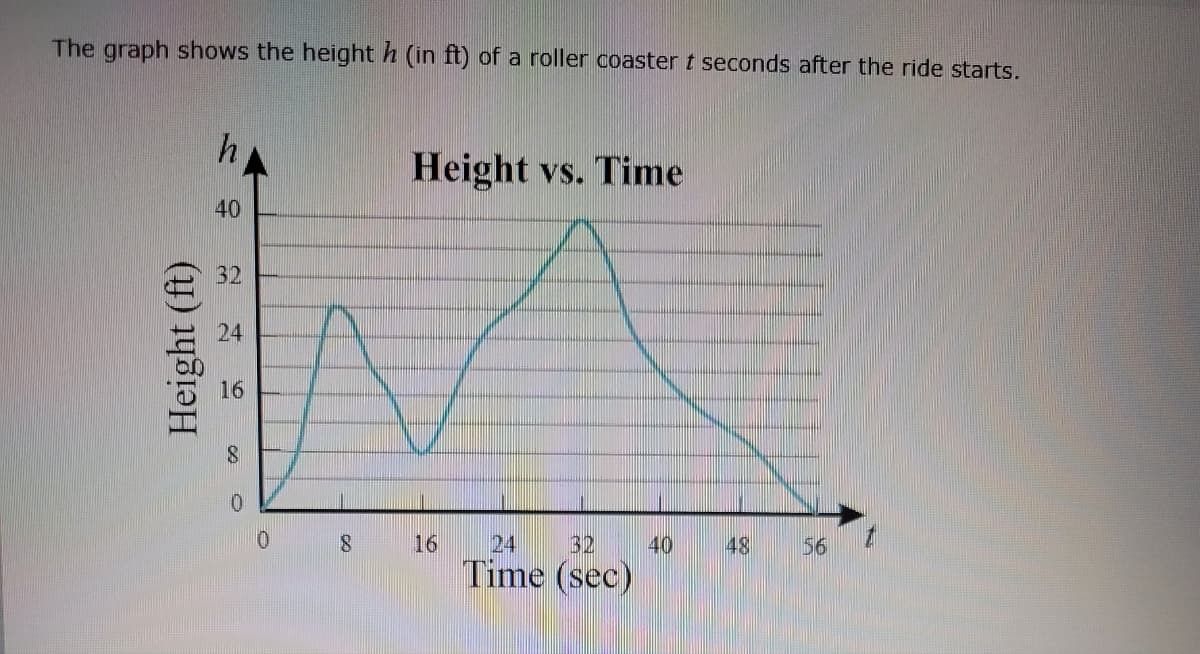
The graph shows the height h (in ft) of a roller coaster t seconds after the ride starts. Height (ft) h 40 32 24 16 Height vs. Time
The graph shows the height h (in ft) of a roller coaster t seconds after the ride starts. Height (ft) h 40 32 24 16 Height vs. Time

Algebra & Trigonometry with Analytic Geometry
13th Edition
ISBN:9781133382119
Author:Swokowski
Publisher:Swokowski
Chapter3: Functions And Graphs
Section3.5: Graphs Of Functions
Problem 35E

Related questions
Question
100%
1. The height of the roller coaster is increasing on the intervals 0,8 and 16,32
2. The height of the roller coaster is dereasing on the intervals 8,16 and 32,56
3. Estimate the times and values of any relative maxima or minima on the interval (0,56)
At t=__?, the function has a relative minimum of__?
Transcribed Image Text:The graph shows the height h (in ft) of a roller coaster t seconds after the ride starts.
Height (ft)
h
40
32
24
16
10
8
Height vs. Time
16
24
Time (sec)
32 40
48
56
Expert Solution
Step 1
At t=8, the function has a relative maximum of 28.
At t=32, the function has a relative maximum of 40.

Trending now
This is a popular solution!

Step by step
Solved in 2 steps

Recommended textbooks for you
Algebra & Trigonometry with Analytic Geometry
Algebra
ISBN:
9781133382119
Author:
Swokowski
Publisher:
Cengage


Big Ideas Math A Bridge To Success Algebra 1: Stu…
Algebra
ISBN:
9781680331141
Author:
HOUGHTON MIFFLIN HARCOURT
Publisher:
Houghton Mifflin Harcourt
Algebra & Trigonometry with Analytic Geometry
Algebra
ISBN:
9781133382119
Author:
Swokowski
Publisher:
Cengage
Big Ideas Math A Bridge To Success Algebra 1: Stu…
Algebra
ISBN:
9781680331141
Author:
HOUGHTON MIFFLIN HARCOURT
Publisher:
Houghton Mifflin Harcourt

Glencoe Algebra 1, Student Edition, 9780079039897…
Algebra
ISBN:
9780079039897
Author:
Carter
Publisher:
McGraw Hill

College Algebra (MindTap Course List)
Algebra
ISBN:
9781305652231
Author:
R. David Gustafson, Jeff Hughes
Publisher:
Cengage Learning