The graph shows the number of trips taken annually on a certain state's mass transportation system. Find the average rate of change of the number of trips from 1992 to 1995, from 1995 to 2000, and from 1992 to 1998. 10- 9- 8- Annual Trips on a State's Mass Transportation System 8.6 million 7+ 1992 7.7 million 1994 1996 9.9 million 8.8 million 1998 2000 Q ... The average rate of change from 1992 to 1995 is (Round to three decimal places as needed.) million per year
The graph shows the number of trips taken annually on a certain state's mass transportation system. Find the average rate of change of the number of trips from 1992 to 1995, from 1995 to 2000, and from 1992 to 1998. 10- 9- 8- Annual Trips on a State's Mass Transportation System 8.6 million 7+ 1992 7.7 million 1994 1996 9.9 million 8.8 million 1998 2000 Q ... The average rate of change from 1992 to 1995 is (Round to three decimal places as needed.) million per year

College Algebra
7th Edition
ISBN:9781305115545
Author:James Stewart, Lothar Redlin, Saleem Watson
Publisher:James Stewart, Lothar Redlin, Saleem Watson
Chapter2: Functions
Section2.4: Average Rate Of Change Of A Function
Problem 33E: DVD Player sales The table shows the number of DVD play-ers sold in a small electronics store in the...

Related questions
Question
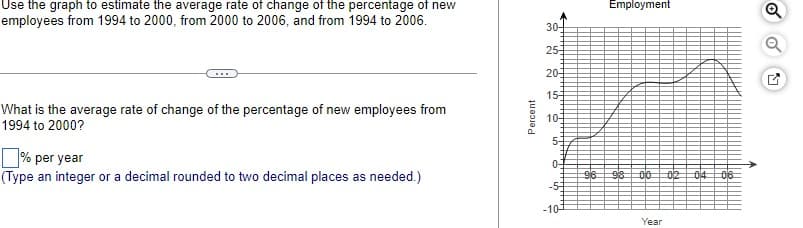
Transcribed Image Text:Use the graph to estimate the average rate of change of the percentage of new
employees from 1994 to 2000, from 2000 to 2006, and from 1994 to 2006.
What is the average rate of change of the percentage of new employees from
1994 to 2000?
% per year
(Type an integer or a decimal rounded to two decimal places as needed.)
Percent
30-
25-3
20-
15-
104
5
0
-5-
-10
Employment
96 98 00
Year
02 04 06
Q
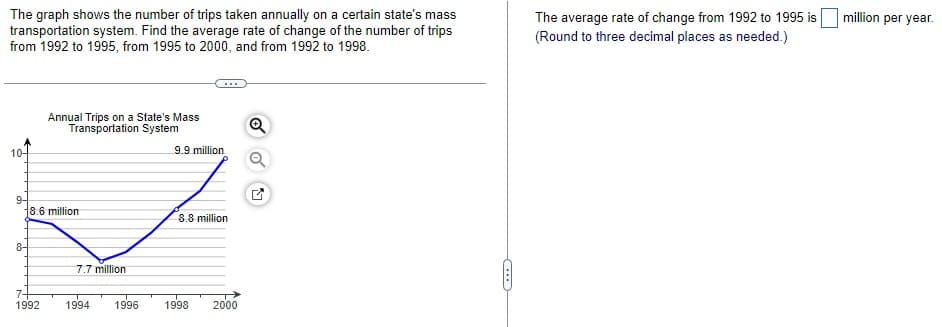
Transcribed Image Text:The graph shows the number of trips taken annually on a certain state's mass
transportation system. Find the average rate of change of the number of trips
from 1992 to 1995, from 1995 to 2000, and from 1992 to 1998.
10-
9-
8-
Annual Trips on a State's Mass
Transportation System
8.6 million
1992
7.7 million
1994
9.9 million
8.8 million
1996 1998 2000
Q
The average rate of change from 1992 to 1995 is
(Round to three decimal places as needed.)
million per year.
Expert Solution
This question has been solved!
Explore an expertly crafted, step-by-step solution for a thorough understanding of key concepts.

This is a popular solution!

Trending now
This is a popular solution!

Step by step
Solved in 2 steps

Recommended textbooks for you
College Algebra
Algebra
ISBN:
9781305115545
Author:
James Stewart, Lothar Redlin, Saleem Watson
Publisher:
Cengage Learning

Functions and Change: A Modeling Approach to Coll…
Algebra
ISBN:
9781337111348
Author:
Bruce Crauder, Benny Evans, Alan Noell
Publisher:
Cengage Learning

Algebra & Trigonometry with Analytic Geometry
Algebra
ISBN:
9781133382119
Author:
Swokowski
Publisher:
Cengage
College Algebra
Algebra
ISBN:
9781305115545
Author:
James Stewart, Lothar Redlin, Saleem Watson
Publisher:
Cengage Learning
Functions and Change: A Modeling Approach to Coll…
Algebra
ISBN:
9781337111348
Author:
Bruce Crauder, Benny Evans, Alan Noell
Publisher:
Cengage Learning
Algebra & Trigonometry with Analytic Geometry
Algebra
ISBN:
9781133382119
Author:
Swokowski
Publisher:
Cengage

College Algebra (MindTap Course List)
Algebra
ISBN:
9781305652231
Author:
R. David Gustafson, Jeff Hughes
Publisher:
Cengage Learning

Glencoe Algebra 1, Student Edition, 9780079039897…
Algebra
ISBN:
9780079039897
Author:
Carter
Publisher:
McGraw Hill

Trigonometry (MindTap Course List)
Trigonometry
ISBN:
9781337278461
Author:
Ron Larson
Publisher:
Cengage Learning