The graph shows the rate of change of the revenue of a company from 2000 through 2015. dR dt 450 400 350 300 250 200 150 100 50 2. 10 12 14 16 Year (0 + 2000) (a) Approximate the rate of change of the revenue in 2010. Explain your reasoning. dR was approximately $ dt In 2010, t = x , the rate of change of revenue, thousand per year. (b) Approximate the year when the rate of change of the revenue is the greatest. Explain your reasoning. dR was approximately $ dt In 2000, t = the rate of change of revenue, thousand per year, which was the absolute maximum on the given interval 0 sts 15. Enter an exact number. (c) Approximate the year when the revenue is maximum. Explain your reasoning. Kahe of change of revenue (in thousands of dollars per year)
The graph shows the rate of change of the revenue of a company from 2000 through 2015. dR dt 450 400 350 300 250 200 150 100 50 2. 10 12 14 16 Year (0 + 2000) (a) Approximate the rate of change of the revenue in 2010. Explain your reasoning. dR was approximately $ dt In 2010, t = x , the rate of change of revenue, thousand per year. (b) Approximate the year when the rate of change of the revenue is the greatest. Explain your reasoning. dR was approximately $ dt In 2000, t = the rate of change of revenue, thousand per year, which was the absolute maximum on the given interval 0 sts 15. Enter an exact number. (c) Approximate the year when the revenue is maximum. Explain your reasoning. Kahe of change of revenue (in thousands of dollars per year)

Glencoe Algebra 1, Student Edition, 9780079039897, 0079039898, 2018
18th Edition
ISBN:9780079039897
Author:Carter
Publisher:Carter
Chapter3: Linear And Nonlinear Functions
Section3.3: Rate Of Change And Slope
Problem 19PPS

Related questions
Question
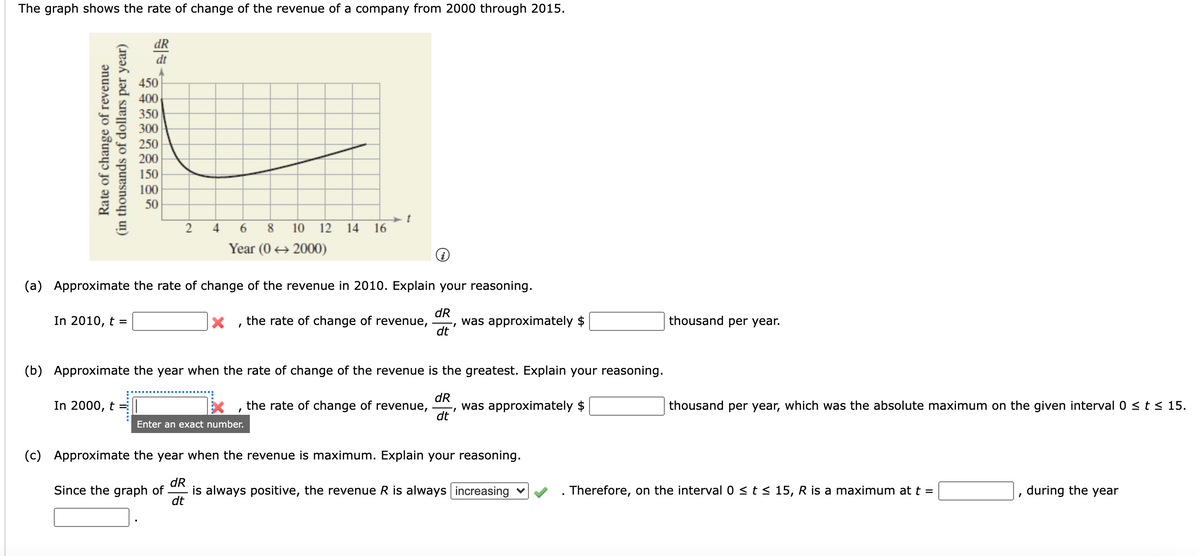
Transcribed Image Text:The graph shows the rate of change of the revenue of a company from 2000 through 2015.
dR
dt
450
400
350
300
250
200
150
100
50
4
6
8
10
12 14
16
Year (0 + 2000)
(a) Approximate the rate of change of the revenue in 2010. Explain your reasoning.
dR
In 2010, t =
the rate of change of revenue,
was approximately $
thousand per year.
1.
dt
(b) Approximate the year when the rate of change of the revenue is the greatest. Explain your reasoning.
In 2000, t =
the rate of change of revenue,
dR
was approximately $
thousand per year, which was the absolute maximum on the given interval 0 <t< 15.
1.
dt
Enter an exact number.
(c) Approximate the year when the revenue is maximum. Explain your reasoning.
dR
Since the graph of
is always positive, the revenue R is always | increasing v
dt
Therefore, on the interval 0 < t < 15, R is a maximum at t =
during the year
Rate of change of revenue
(in thousands of dollars per year)
Expert Solution
This question has been solved!
Explore an expertly crafted, step-by-step solution for a thorough understanding of key concepts.

This is a popular solution!

Trending now
This is a popular solution!

Step by step
Solved in 2 steps

Recommended textbooks for you
Glencoe Algebra 1, Student Edition, 9780079039897…
Algebra
ISBN:
9780079039897
Author:
Carter
Publisher:
McGraw Hill

Big Ideas Math A Bridge To Success Algebra 1: Stu…
Algebra
ISBN:
9781680331141
Author:
HOUGHTON MIFFLIN HARCOURT
Publisher:
Houghton Mifflin Harcourt

Algebra and Trigonometry (MindTap Course List)
Algebra
ISBN:
9781305071742
Author:
James Stewart, Lothar Redlin, Saleem Watson
Publisher:
Cengage Learning
Glencoe Algebra 1, Student Edition, 9780079039897…
Algebra
ISBN:
9780079039897
Author:
Carter
Publisher:
McGraw Hill
Big Ideas Math A Bridge To Success Algebra 1: Stu…
Algebra
ISBN:
9781680331141
Author:
HOUGHTON MIFFLIN HARCOURT
Publisher:
Houghton Mifflin Harcourt
Algebra and Trigonometry (MindTap Course List)
Algebra
ISBN:
9781305071742
Author:
James Stewart, Lothar Redlin, Saleem Watson
Publisher:
Cengage Learning


College Algebra
Algebra
ISBN:
9781305115545
Author:
James Stewart, Lothar Redlin, Saleem Watson
Publisher:
Cengage Learning

Functions and Change: A Modeling Approach to Coll…
Algebra
ISBN:
9781337111348
Author:
Bruce Crauder, Benny Evans, Alan Noell
Publisher:
Cengage Learning