The graph to the right is the uniform density function for a friend who is x minutes late. Find the probability that the friend is at least 13 minutes late. 1/30- 30 X 10 20 Time (min) The probability that the friend is at least 13 minutes late is. (Type an integer or a decimal. Round to three decimal places as needed.) Density
The graph to the right is the uniform density function for a friend who is x minutes late. Find the probability that the friend is at least 13 minutes late. 1/30- 30 X 10 20 Time (min) The probability that the friend is at least 13 minutes late is. (Type an integer or a decimal. Round to three decimal places as needed.) Density

Functions and Change: A Modeling Approach to College Algebra (MindTap Course List)
6th Edition
ISBN:9781337111348
Author:Bruce Crauder, Benny Evans, Alan Noell
Publisher:Bruce Crauder, Benny Evans, Alan Noell
Chapter1: Functions
Section1.2: Functions Given By Tables
Problem 2TU: Use the table of values you made in part 4 of the example to find the limiting value of the average...

Related questions
Question
7
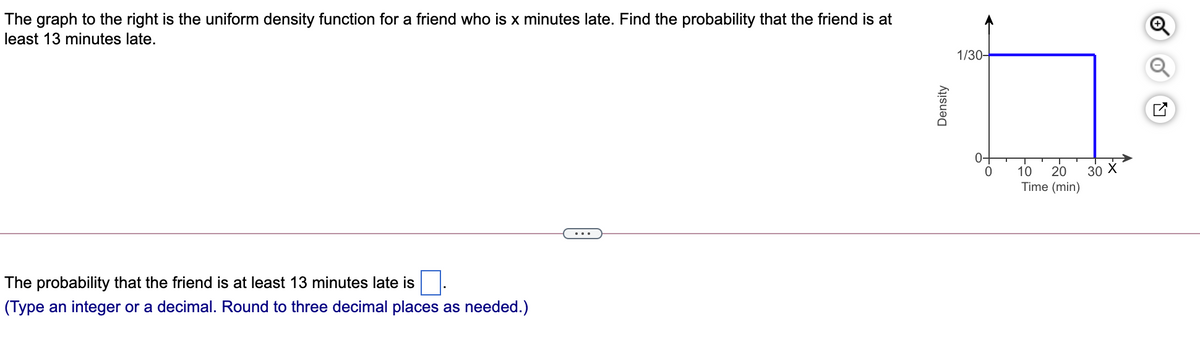
Transcribed Image Text:The graph to the right is the uniform density function for a friend who is x minutes late. Find the probability that the friend is at
least 13 minutes late.
1/30-
0-
30 X
20
Time (min)
10
The probability that the friend is at least 13 minutes late is
(Type an integer or a decimal. Round to three decimal places as needed.)
Density
Expert Solution
This question has been solved!
Explore an expertly crafted, step-by-step solution for a thorough understanding of key concepts.

This is a popular solution!

Trending now
This is a popular solution!

Step by step
Solved in 2 steps with 2 images

Recommended textbooks for you
Functions and Change: A Modeling Approach to Coll…
Algebra
ISBN:
9781337111348
Author:
Bruce Crauder, Benny Evans, Alan Noell
Publisher:
Cengage Learning

Functions and Change: A Modeling Approach to Coll…
Algebra
ISBN:
9781337111348
Author:
Bruce Crauder, Benny Evans, Alan Noell
Publisher:
Cengage Learning