The graphs in the figure below represent the velocity, v, of a particle moving along the x-axis for time 0 st s 5. The vertical scales of all graphs are the same. A negative velocity corresponds to motion to the left. (0) () 17 U (V) V (1) V (IV) V Identify the graph showing which particle: (a) Has a constant acceleration. ---Select--- (b) Ends up farthest to the left of where it started. ---Select-- (c) Ends up the farthest from its starting point. --Select-- (d) Experiences the greatest initial acceleration. --Select-- (e) Has the greatest average velocity. ---Select-- (f) Has the greatest average acceleration. ---Select--
The graphs in the figure below represent the velocity, v, of a particle moving along the x-axis for time 0 st s 5. The vertical scales of all graphs are the same. A negative velocity corresponds to motion to the left. (0) () 17 U (V) V (1) V (IV) V Identify the graph showing which particle: (a) Has a constant acceleration. ---Select--- (b) Ends up farthest to the left of where it started. ---Select-- (c) Ends up the farthest from its starting point. --Select-- (d) Experiences the greatest initial acceleration. --Select-- (e) Has the greatest average velocity. ---Select-- (f) Has the greatest average acceleration. ---Select--

Physics for Scientists and Engineers, Technology Update (No access codes included)
9th Edition
ISBN:9781305116399
Author:Raymond A. Serway, John W. Jewett
Publisher:Raymond A. Serway, John W. Jewett
Chapter2: Motion In One Dimension
Section: Chapter Questions
Problem 2.2OQ: A racing car starts from rest at t = 0 and reaches a final speed at time t. II the acceleration of...

Related questions

Question
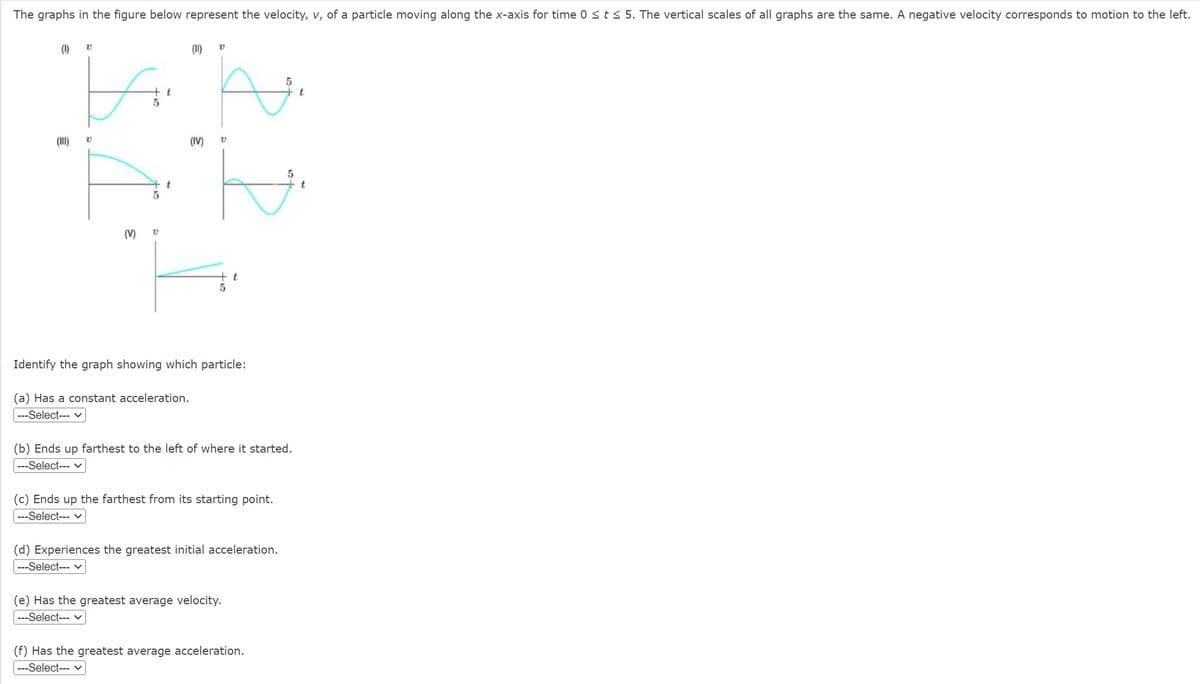
Transcribed Image Text:The graphs in the figure below represent the velocity, v, of a particle moving along the x-axis for time 0 ≤ t ≤ 5. The vertical scales of all graphs are the same. A negative velocity corresponds to motion to the left.
(0)
(1)
V
Ho
5
V
(V)
V
t
t
(11) V
(IV)
P. P
t
Identify the graph showing which particle:
(a) Has a constant acceleration.
---Select--- ✓
(b) Ends up farthest to the left of where it started.
---Select--- ✓
(c) Ends up the farthest from its starting point.
---Select--- ✓
(e) Has the greatest average velocity.
---Select--- ✓
(d) Experiences the greatest initial acceleration.
---Select--- ✓
(f) Has the greatest average acceleration.
---Select--- ✓
Expert Solution
This question has been solved!
Explore an expertly crafted, step-by-step solution for a thorough understanding of key concepts.

This is a popular solution!
Step 1: State the given values, the values to be calculated and the theory needed in the question
VIEWStep 2: Obtaining the graph showing the particle with constant acceleration.
VIEWStep 3: Obtaining the graph showing the particle ending up farthest to the left of the starting point.
VIEWStep 4: Obtaining the graph showing the particle ending up farthest from its starting point.
VIEWStep 5: Obtaining the graph showing the particle having the greatest initial acceleration.
VIEWStep 6: Obtaining the graph showing the particle having the greatest average velocity.
VIEWSolution
VIEW
Trending now
This is a popular solution!

Step by step
Solved in 7 steps with 5 images

Knowledge Booster


Learn more about
Need a deep-dive on the concept behind this application? Look no further. Learn more about this topic, physics and related others by exploring similar questions and additional content below.Recommended textbooks for you
Physics for Scientists and Engineers, Technology …
Physics
ISBN:
9781305116399
Author:
Raymond A. Serway, John W. Jewett
Publisher:
Cengage Learning

Principles of Physics: A Calculus-Based Text
Physics
ISBN:
9781133104261
Author:
Raymond A. Serway, John W. Jewett
Publisher:
Cengage Learning

Physics for Scientists and Engineers: Foundations…
Physics
ISBN:
9781133939146
Author:
Katz, Debora M.
Publisher:
Cengage Learning
Physics for Scientists and Engineers, Technology …
Physics
ISBN:
9781305116399
Author:
Raymond A. Serway, John W. Jewett
Publisher:
Cengage Learning
Principles of Physics: A Calculus-Based Text
Physics
ISBN:
9781133104261
Author:
Raymond A. Serway, John W. Jewett
Publisher:
Cengage Learning
Physics for Scientists and Engineers: Foundations…
Physics
ISBN:
9781133939146
Author:
Katz, Debora M.
Publisher:
Cengage Learning