The graphs show the percentage of electricity production by source in 2009 and 2019 for the state of Texas. (a) Based on the graphs, describe the trend in electricity production from wind between 2009 and 2019.  (b) Describe an environmental change that is likely to have occurred in the state of Texas that resulted from the change in coal production indicated in the graphs between 2009 and 2019.  (c) Identify and describe one nonrenewable energy source that could be used for electricity production in the state of Texas that was not being used in 2009.

Applications and Investigations in Earth Science (9th Edition)
9th Edition
ISBN:9780134746241
Author:Edward J. Tarbuck, Frederick K. Lutgens, Dennis G. Tasa
Publisher:Edward J. Tarbuck, Frederick K. Lutgens, Dennis G. Tasa
Chapter1: The Study Of Minerals
Section: Chapter Questions
Problem 1LR
icon
Related questions
Question

The graphs show the percentage of electricity production by source in 2009 and 2019 for the state of Texas.

(a) Based on the graphs, describe the trend in electricity production from wind between 2009 and 2019. 

(b) Describe an environmental change that is likely to have occurred in the state of Texas that resulted from the change in coal production indicated in the graphs between 2009 and 2019. 

(c) Identify and describe one nonrenewable energy source that could be used for electricity production in the state of Texas that was not being used in 2009. 

(d) The Texas state government decided to offer subsidies in 2020 for energy production by wind power in the form of a production tax credit. Explain how these government subsidies would affect the energy production by natural gas by 2030 in Texas.

2009 Texas
Electricity Production
by Source (%)
2019 Texas
Electricity Production
by Source (%)
Wind
6.4 Hydro
0.4
Solar
Hydro
0.45
1.35
Nuclear
13.8
Wind
20.21
Coal
36.8
Natural Gas
42.6
Nuclear
10.97
Natural Gas
47.00
Coal
20.02
Transcribed Image Text:2009 Texas Electricity Production by Source (%) 2019 Texas Electricity Production by Source (%) Wind 6.4 Hydro 0.4 Solar Hydro 0.45 1.35 Nuclear 13.8 Wind 20.21 Coal 36.8 Natural Gas 42.6 Nuclear 10.97 Natural Gas 47.00 Coal 20.02
Expert Solution
Introduction:

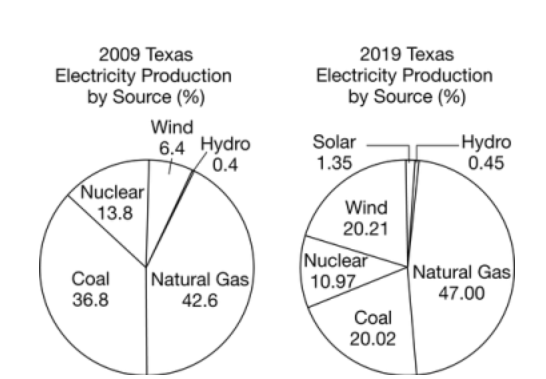
The given graph shows that the energy sources being used for electricity production include nuclear energy, wind, hydropower, natural gas, and coal. As per Bartleby's guidelines, only the first three subparts of the question are being answered.

trending now

Trending now

This is a popular solution!

steps

Step by step

Solved in 3 steps

Blurred answer
Follow-up Questions
Read through expert solutions to related follow-up questions below.
Follow-up Question

what would be on renewable energy?

Solution
Bartleby Expert
SEE SOLUTION
Recommended textbooks for you
Applications and Investigations in Earth Science …
Earth Science
ISBN:
9780134746241
Author:
Edward J. Tarbuck, Frederick K. Lutgens, Dennis G. Tasa
Publisher:
PEARSON
Exercises for Weather & Climate (9th Edition)
Earth Science
ISBN:
9780134041360
Author:
Greg Carbone
Publisher:
PEARSON
Environmental Science
Earth Science
ISBN:
9781260153125
Author:
William P Cunningham Prof., Mary Ann Cunningham Professor
Publisher:
McGraw-Hill Education
Earth Science (15th Edition)
Earth Science
ISBN:
9780134543536
Author:
Edward J. Tarbuck, Frederick K. Lutgens, Dennis G. Tasa
Publisher:
PEARSON
Environmental Science (MindTap Course List)
Earth Science
ISBN:
9781337569613
Author:
G. Tyler Miller, Scott Spoolman
Publisher:
Cengage Learning
Physical Geology
Physical Geology
Earth Science
ISBN:
9781259916823
Author:
Plummer, Charles C., CARLSON, Diane H., Hammersley, Lisa
Publisher:
Mcgraw-hill Education,