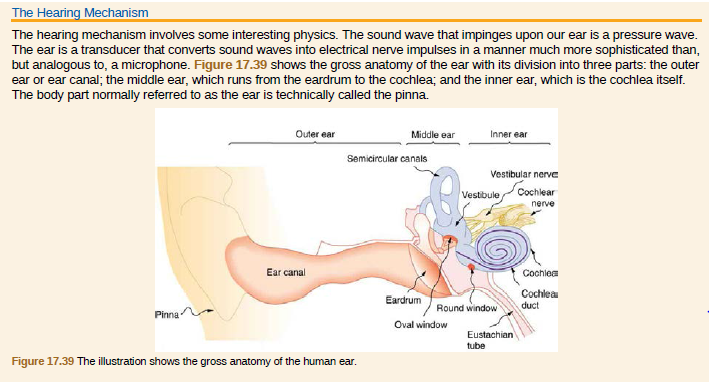
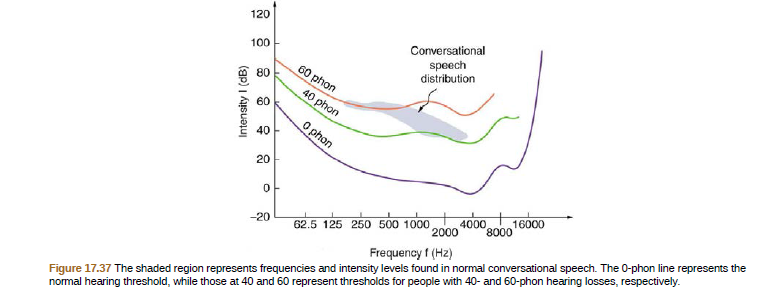
The Hearing Mechanism The hearing mechanism involves some interesting physics. The sound wave that impinges upon our ear is a pressure wave. The ear is a transducer that converts sound waves into electrical nerve impulses in a manner much more sophisticated than, but analogous to, a microphone. Figure 17.39 shows the gross anatomy of the ear with its division into three parts: the outer ear or ear canal; the middle ear, which runs from the eardrum to the cochlea; and the inner ear, which is the cochlea itself. The body part normally referred to as the ear is technically called the pinna. Outer ear Middle ear Inner ear Semicircular canals Vestibular nerve Vestibule Cochlear nerve Ear canal Cochlea Cochlea Eardrum Round window duct Pinna. Oval window Eustachian tube Figure 17.39 The illustration shows the gross anatomy of the human ear. 120 Conversational 100 speech 60 phon distribution 80 40 phon 60 O phon 40 20 62.5 125 250 500 1000 2000 4000 16000 8000 -20 Figure 17.37 The shaded region represents frequencies and intensity levels found in normal conversational speech. The 0-phon line represents the normal hearing threshold, while those at 40 and 60 represent thresholds for people with 40- and 60-phon hearing losses, respectively. Frequency f (Hz) Intensity I (dB)


Properties of sound
A sound wave is a mechanical wave (or mechanical vibration) that transit through media such as gas (air), liquid (water), and solid (wood).
Quality Of Sound
A sound or a sound wave is defined as the energy produced due to the vibrations of particles in a medium. When any medium produces a disturbance or vibrations, it causes a movement in the air particles which produces sound waves. Molecules in the air vibrate about a certain average position and create compressions and rarefactions. This is called pitch which is defined as the frequency of sound. The frequency is defined as the number of oscillations in pressure per second.
Categories of Sound Wave
People perceive sound in different ways, like a medico student takes sound as vibration produced by objects reaching the human eardrum. A physicist perceives sound as vibration produced by an object, which produces disturbances in nearby air molecules that travel further. Both of them describe it as vibration generated by an object, the difference is one talks about how it is received and other deals with how it travels and propagates across various mediums.
The ear canal resonates like a tube closed at one end. (17.39.) If ear canals range in length from 1.80 to 2.60 cm in an average population, what is the range of fundamental resonant frequencies? Take air temperature to be 37.0ºC , which is the same as body temperature. How does this result correlate with the intensity versus frequency graph (17.37) of the human ear?


Trending now
This is a popular solution!

Step by step
Solved in 3 steps with 4 images


