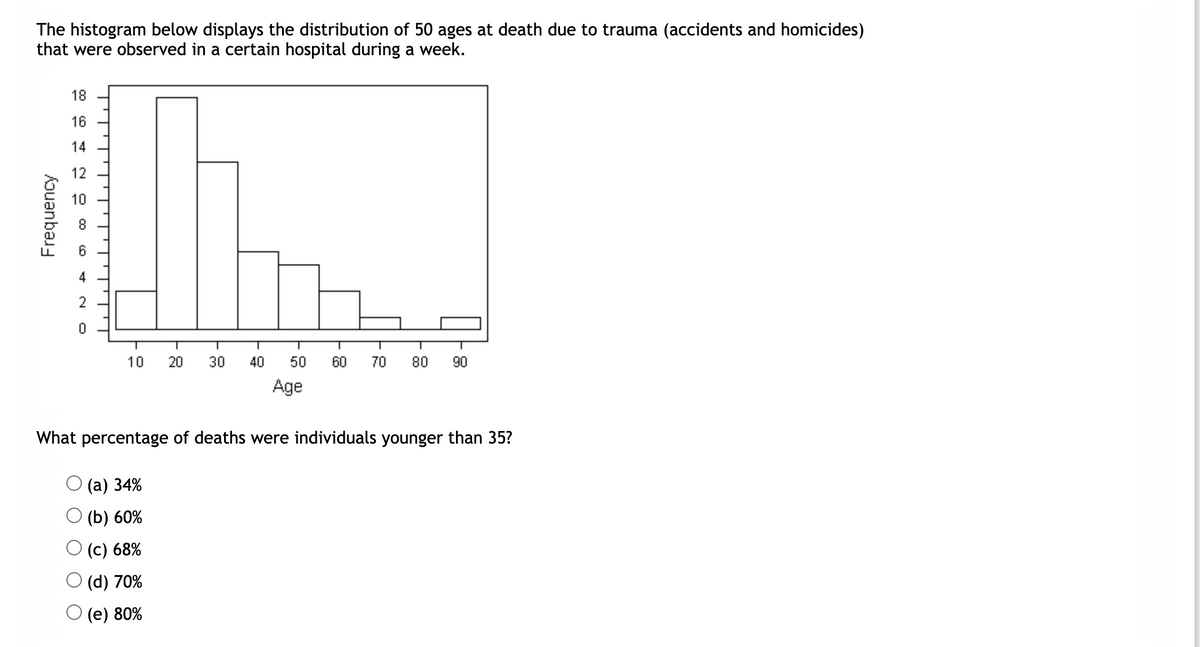
The histogram below displays the distribution of 50 ages at death due to trauma (accidents and homicides) that were observed in a certain hospital during a week. Frequency 18 16 14 12 10 0 T 10 20 T T T T T 30 40 50 60 70 80 90 Age What percentage of deaths were individuals younger than 35? (a) 34% (b) 60% (c) 68% (d) 70% Ⓒ (e) 80%
The histogram below displays the distribution of 50 ages at death due to trauma (accidents and homicides) that were observed in a certain hospital during a week. Frequency 18 16 14 12 10 0 T 10 20 T T T T T 30 40 50 60 70 80 90 Age What percentage of deaths were individuals younger than 35? (a) 34% (b) 60% (c) 68% (d) 70% Ⓒ (e) 80%

Big Ideas Math A Bridge To Success Algebra 1: Student Edition 2015
1st Edition
ISBN:9781680331141
Author:HOUGHTON MIFFLIN HARCOURT
Publisher:HOUGHTON MIFFLIN HARCOURT
Chapter11: Data Analysis And Displays
Section: Chapter Questions
Problem 10CT

Related questions
Question
10. Please answer this question ASAP. Please circle all answers, please be organized.
Transcribed Image Text:The histogram below displays the distribution of 50 ages at death due to trauma (accidents and homicides)
that were observed in a certain hospital during a week.
Frequency
18
16
14
12
10
co
4
2
0
10 20 30
40
T
50 60 70 80 90
Age
What percentage of deaths were individuals younger than 35?
(a) 34%
(b) 60%
(c) 68%
(d) 70%
(e) 80%
Expert Solution
This question has been solved!
Explore an expertly crafted, step-by-step solution for a thorough understanding of key concepts.

This is a popular solution!

Trending now
This is a popular solution!

Step by step
Solved in 2 steps with 1 images

Recommended textbooks for you
Big Ideas Math A Bridge To Success Algebra 1: Stu…
Algebra
ISBN:
9781680331141
Author:
HOUGHTON MIFFLIN HARCOURT
Publisher:
Houghton Mifflin Harcourt


Glencoe Algebra 1, Student Edition, 9780079039897…
Algebra
ISBN:
9780079039897
Author:
Carter
Publisher:
McGraw Hill
Big Ideas Math A Bridge To Success Algebra 1: Stu…
Algebra
ISBN:
9781680331141
Author:
HOUGHTON MIFFLIN HARCOURT
Publisher:
Houghton Mifflin Harcourt
Glencoe Algebra 1, Student Edition, 9780079039897…
Algebra
ISBN:
9780079039897
Author:
Carter
Publisher:
McGraw Hill