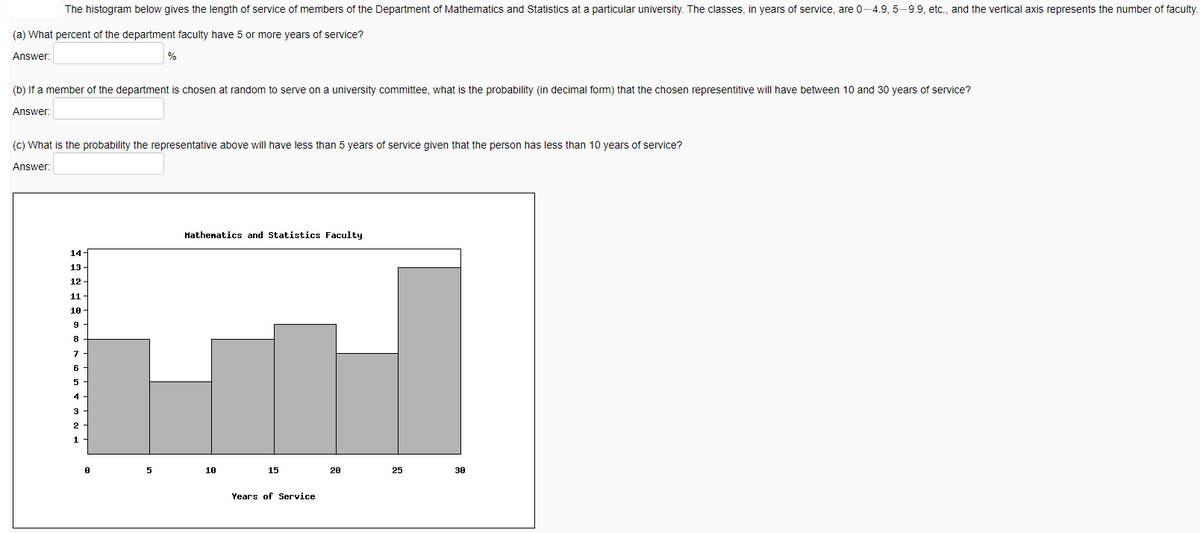
The histogram below gives the length of service of members of the Department of Mathematics and Statistics at a particular university. The classes, in years of service, are 0-4.9, 5-9.9, etc., and the vertical axis represents the number ) What percent of the department faculty have 5 or more years of service? nswer: % ) If a member of the department is chosen at random to serve on a university committee, what is the probability (in decimal form) that the chosen representitive will have between 10 and 30 years service? nswer: ) What is the probability the representative above will have less than 5 years service given that the person has less than 10 years of service? nswer. Hathenatics and Statistics Faculty 14 13- 12- 11


Inverse Normal Distribution
The method used for finding the corresponding z-critical value in a normal distribution using the known probability is said to be an inverse normal distribution. The inverse normal distribution is a continuous probability distribution with a family of two parameters.
Mean, Median, Mode
It is a descriptive summary of a data set. It can be defined by using some of the measures. The central tendencies do not provide information regarding individual data from the dataset. However, they give a summary of the data set. The central tendency or measure of central tendency is a central or typical value for a probability distribution.
Z-Scores
A z-score is a unit of measurement used in statistics to describe the position of a raw score in terms of its distance from the mean, measured with reference to standard deviation from the mean. Z-scores are useful in statistics because they allow comparison between two scores that belong to different normal distributions.


Trending now
This is a popular solution!

Step by step
Solved in 2 steps


