The histogram shows the distribution of hurricanes that have hit a country from 1851 through 2015, where 1 is the weakest level and 5 is the strongest level. (a) Find the mean, variance, and standard deviation of the probability distribution. (b) Interpret the results. (a) The mean is (Type an integer or a decimal. Do not round.) The variance is (Round to two decimal places as needed.) The standard deviation is (Round to two decimal places as needed.) Probability 0.5- 0.4- 0.3 0.1- 0.0 0.416 -- Hurricanes 0.274 FOL 0.213 0.085 Category 0.012 Q Ly
The histogram shows the distribution of hurricanes that have hit a country from 1851 through 2015, where 1 is the weakest level and 5 is the strongest level. (a) Find the mean, variance, and standard deviation of the probability distribution. (b) Interpret the results. (a) The mean is (Type an integer or a decimal. Do not round.) The variance is (Round to two decimal places as needed.) The standard deviation is (Round to two decimal places as needed.) Probability 0.5- 0.4- 0.3 0.1- 0.0 0.416 -- Hurricanes 0.274 FOL 0.213 0.085 Category 0.012 Q Ly

Glencoe Algebra 1, Student Edition, 9780079039897, 0079039898, 2018
18th Edition
ISBN:9780079039897
Author:Carter
Publisher:Carter
Chapter10: Statistics
Section10.4: Distributions Of Data
Problem 19PFA

Related questions
Question
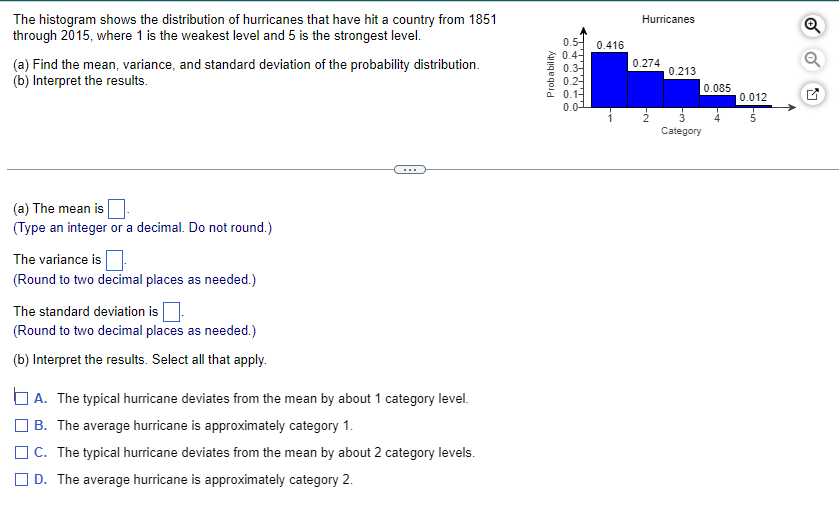
Transcribed Image Text:The histogram shows the distribution of hurricanes that have hit a country from 1851
through 2015, where 1 is the weakest level and 5 is the strongest level.
(a) Find the mean, variance, and standard deviation of the probability distribution.
(b) Interpret the results.
(a) The mean is
(Type an integer or a decimal. Do not round.)
The variance is
(Round to two decimal places as needed.)
The standard deviation is
(Round to two decimal places as needed.)
(b) Interpret the results. Select all that apply.
A. The typical hurricane deviates from the mean by about 1 category level.
B. The average hurricane is approximately category 1.
C. The typical hurricane deviates from the mean by about 2 category levels.
D. The average hurricane is approximately category 2.
Probability
0.5-
0.4-
0.3
0.2-
0.1-
0.0
0.416
Hurricanes
0.274
0.213
Category
0.085
0.012
Q
Expert Solution
This question has been solved!
Explore an expertly crafted, step-by-step solution for a thorough understanding of key concepts.

This is a popular solution!

Trending now
This is a popular solution!

Step by step
Solved in 4 steps with 10 images

Recommended textbooks for you
Glencoe Algebra 1, Student Edition, 9780079039897…
Algebra
ISBN:
9780079039897
Author:
Carter
Publisher:
McGraw Hill
Glencoe Algebra 1, Student Edition, 9780079039897…
Algebra
ISBN:
9780079039897
Author:
Carter
Publisher:
McGraw Hill