The histograms each represent part of a binomial distribution. Each distribution has the same probability of success, p, but different numbers of trials, n. Identify the unusual values of x in each histogram. (a) n=4 AP(x) 0.5- 0.4- 0.3- 0.2- (b) n = 8 (c) n= 12 AP(x) 0.5- 0.4- 0.3- Q AP(x) 04- 0.3- 0.2- 0.2- 0.1- 0.1- 0.1- 0- ó i 234 5678910 -> 0 123456789 10 0- ó123 45 6789 1011 1213 Identify the unusual values of x in histogram (a). Choose the correct answer below. O A. x=0, x=1, x= 2, and x=3 O B. x=3 OC. x=0 O D. There are no unusual values of x in the histogram. Identify the unusual values of x in histogram (b). Choose the correct answer below. O A. x=6 O B. x=0, x= 1, x=2, and x= 3 O C. x=0 O D. There are no unusual values of x in the histogram. Identify the unusual values of x in histogram (c). Choose the correct answer below. O A. x=0 O B. x=0, x= 1, x= 2, and x=3 O C. x= 0, x=1, x= 2, x= 3, x= 4, x=5, and x= 12 Click to select your answer.
The histograms each represent part of a binomial distribution. Each distribution has the same probability of success, p, but different numbers of trials, n. Identify the unusual values of x in each histogram. (a) n=4 AP(x) 0.5- 0.4- 0.3- 0.2- (b) n = 8 (c) n= 12 AP(x) 0.5- 0.4- 0.3- Q AP(x) 04- 0.3- 0.2- 0.2- 0.1- 0.1- 0.1- 0- ó i 234 5678910 -> 0 123456789 10 0- ó123 45 6789 1011 1213 Identify the unusual values of x in histogram (a). Choose the correct answer below. O A. x=0, x=1, x= 2, and x=3 O B. x=3 OC. x=0 O D. There are no unusual values of x in the histogram. Identify the unusual values of x in histogram (b). Choose the correct answer below. O A. x=6 O B. x=0, x= 1, x=2, and x= 3 O C. x=0 O D. There are no unusual values of x in the histogram. Identify the unusual values of x in histogram (c). Choose the correct answer below. O A. x=0 O B. x=0, x= 1, x= 2, and x=3 O C. x= 0, x=1, x= 2, x= 3, x= 4, x=5, and x= 12 Click to select your answer.

College Algebra
7th Edition
ISBN:9781305115545
Author:James Stewart, Lothar Redlin, Saleem Watson
Publisher:James Stewart, Lothar Redlin, Saleem Watson
Chapter9: Counting And Probability
Section9.3: Binomial Probability
Problem 2E: If a binomial experiment has probability p success, then the probability of failure is...

Related questions

Concept explainers
Contingency Table
A contingency table can be defined as the visual representation of the relationship between two or more categorical variables that can be evaluated and registered. It is a categorical version of the scatterplot, which is used to investigate the linear relationship between two variables. A contingency table is indeed a type of frequency distribution table that displays two variables at the same time.
Binomial Distribution
Binomial is an algebraic expression of the sum or the difference of two terms. Before knowing about binomial distribution, we must know about the binomial theorem.
Topic Video
Question
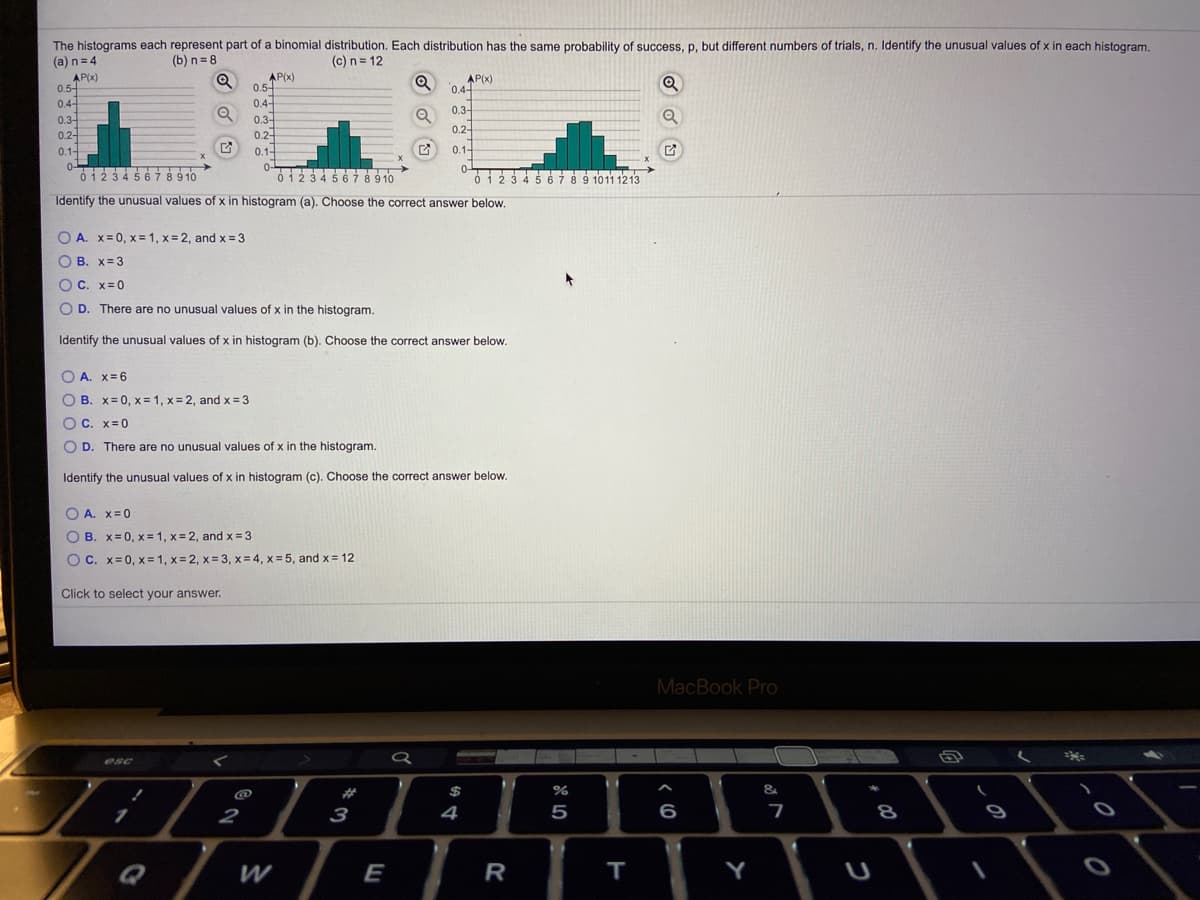
Transcribed Image Text:The histograms each represent part of a binomial distribution. Each distribution has the same probability of success, p, but different numbers of trials, n. Identify the unusual values of x in each histogram.
(a) n= 4
(b) n= 8
(c) n = 12
AP(x)
0.5-
0.4-
0.3-
AP(x)
0.5
0.4-
AP(x)
0.4-
Q
0.3-
0.3-
0.2-
0.1-
0.2-
0.2-
0.1-
0.1-
0-
01234 5 67 89 10
612345678 9 10
2345 6789 1011 1213
Identify the unusual values of x in histogram (a). Choose the correct answer below.
O A. x=0, x =1, x= 2, and x = 3
O B. x= 3
O C. x=0
O D. There are no unusual values of x in the histogram.
Identify the unusual values of x in histogram (b). Choose the correct answer below.
O A. x= 6
O B. x=0, x= 1, x= 2, and x = 3
O C. x=0
O D. There are no unusual values of x in the histogram.
Identify the unusual values of x in histogram (c). Choose the correct answer below.
O A. x=0
O B. x= 0, x = 1, x= 2, and x = 3
O C. x= 0, x = 1, x= 2, x = 3, x= 4, x = 5, and x= 12
Click to select your answer.
MacBook Pro
@
2#
$
2
3
4
5
6
7
8
W
E
R
т
Y
Expert Solution
This question has been solved!
Explore an expertly crafted, step-by-step solution for a thorough understanding of key concepts.

This is a popular solution!

Trending now
This is a popular solution!

Step by step
Solved in 2 steps

Knowledge Booster


Learn more about
Need a deep-dive on the concept behind this application? Look no further. Learn more about this topic, statistics and related others by exploring similar questions and additional content below.Recommended textbooks for you
College Algebra
Algebra
ISBN:
9781305115545
Author:
James Stewart, Lothar Redlin, Saleem Watson
Publisher:
Cengage Learning

College Algebra
Algebra
ISBN:
9781305115545
Author:
James Stewart, Lothar Redlin, Saleem Watson
Publisher:
Cengage Learning