The historical reports from two major networks showed that the mean number of commercials aired during prime time was equal for both networks last year. In order to find out whether they still air the same number of commercials on average or not, random and independent samples of 65 recent prime time airings from both networks have been considered. The first network aired a mean of 109.2 commercials during prime time with a standard deviation of 5.1. The second network aired a mean of 110.8 commercials during prime time with a standard deviation of 5.4. Since the sample sizes are quite large, assume that the population standard deviations can be estimated to be equal to the sample standard deviations, 5.1 and 5.4. At the 0.05 level of significance, is there sufficient evidence to support the claim that the mean number, μ₁, of commercials aired during prime time by the first station is not equal to the mean number, μ₂, of commercials aired during prime time by the second station? Perform a two-tailed test. Then complete the parts below. Carry your intermediate computations to at least three decimal places. (If necessary, consult a list of formulas.) (a) State the null hypothesis Ho and the alternative hypothesis H₁. Ho :O H₁ :0 (b) Determine the type of test statistic to use. Z (c) Find the value of the test statistic. (Round to three or more decimal places.) lir three or more decimal places.) 3 1x X 5 O X S 2 =O OSO 口<口 P S <2 010 ロマロ >
The historical reports from two major networks showed that the mean number of commercials aired during prime time was equal for both networks last year. In order to find out whether they still air the same number of commercials on average or not, random and independent samples of 65 recent prime time airings from both networks have been considered. The first network aired a mean of 109.2 commercials during prime time with a standard deviation of 5.1. The second network aired a mean of 110.8 commercials during prime time with a standard deviation of 5.4. Since the sample sizes are quite large, assume that the population standard deviations can be estimated to be equal to the sample standard deviations, 5.1 and 5.4. At the 0.05 level of significance, is there sufficient evidence to support the claim that the mean number, μ₁, of commercials aired during prime time by the first station is not equal to the mean number, μ₂, of commercials aired during prime time by the second station? Perform a two-tailed test. Then complete the parts below. Carry your intermediate computations to at least three decimal places. (If necessary, consult a list of formulas.) (a) State the null hypothesis Ho and the alternative hypothesis H₁. Ho :O H₁ :0 (b) Determine the type of test statistic to use. Z (c) Find the value of the test statistic. (Round to three or more decimal places.) lir three or more decimal places.) 3 1x X 5 O X S 2 =O OSO 口<口 P S <2 010 ロマロ >

Glencoe Algebra 1, Student Edition, 9780079039897, 0079039898, 2018
18th Edition
ISBN:9780079039897
Author:Carter
Publisher:Carter
Chapter10: Statistics
Section10.3: Measures Of Spread
Problem 1GP

Related questions
Question
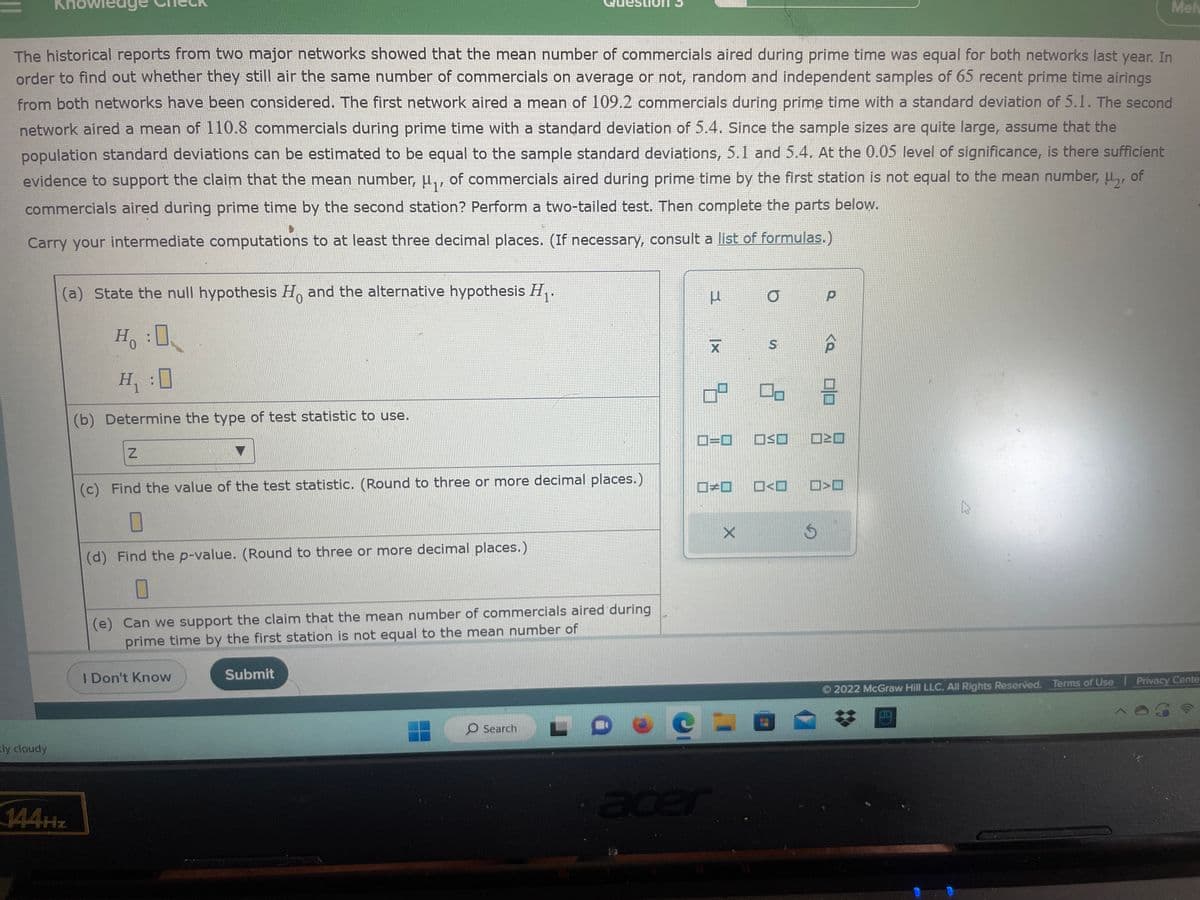
Transcribed Image Text:The historical reports from two major networks showed that the mean number of commercials aired during prime time was equal for both networks last year. In
order to find out whether they still air the same number of commercials on average or not, random and independent samples of 65 recent prime time airings
from both networks have been considered. The first network aired a mean of 109.2 commercials during prime time with a standard deviation of 5.1. The second
network aired a mean of 110.8 commercials during prime time with a standard deviation of 5.4. Since the sample sizes are quite large, assume that the
population standard deviations can be estimated to be equal to the sample standard deviations, 5.1 and 5.4. At the 0.05 level of significance, is there sufficient
evidence to support the claim that the mean number, μ₁, of commercials aired during prime time by the first station is not equal to the mean number, μ₂, of
commercials aired during prime time by the second station? Perform a two-tailed test. Then complete the parts below.
Carry your intermediate computations to at least three decimal places. (If necessary, consult a list of formulas.)
tly cloudy
(a) State the null hypothesis Ho and the alternative hypothesis H₁.
0
144Hz
H. :O
Ho
H₁:0
(b) Determine the type of test statistic to use.
Z
(c) Find the value of the test statistic. (Round to three or more decimal places.)
0
(d) Find the p-value. (Round to three or more decimal places.)
0
(e) Can we support the claim that the mean number of commercials aired during
prime time by the first station is not equal to the mean number of
I Don't Know
Submit
O Search
H
XI
7.
0=0
□□
acer
X
O
S
8
OSO
□<口
P
<Q
010
OO
VE
Mel
K
2022 McGraw Hill LLC. All Rights Reserved. Terms of Use | Privacy Cente
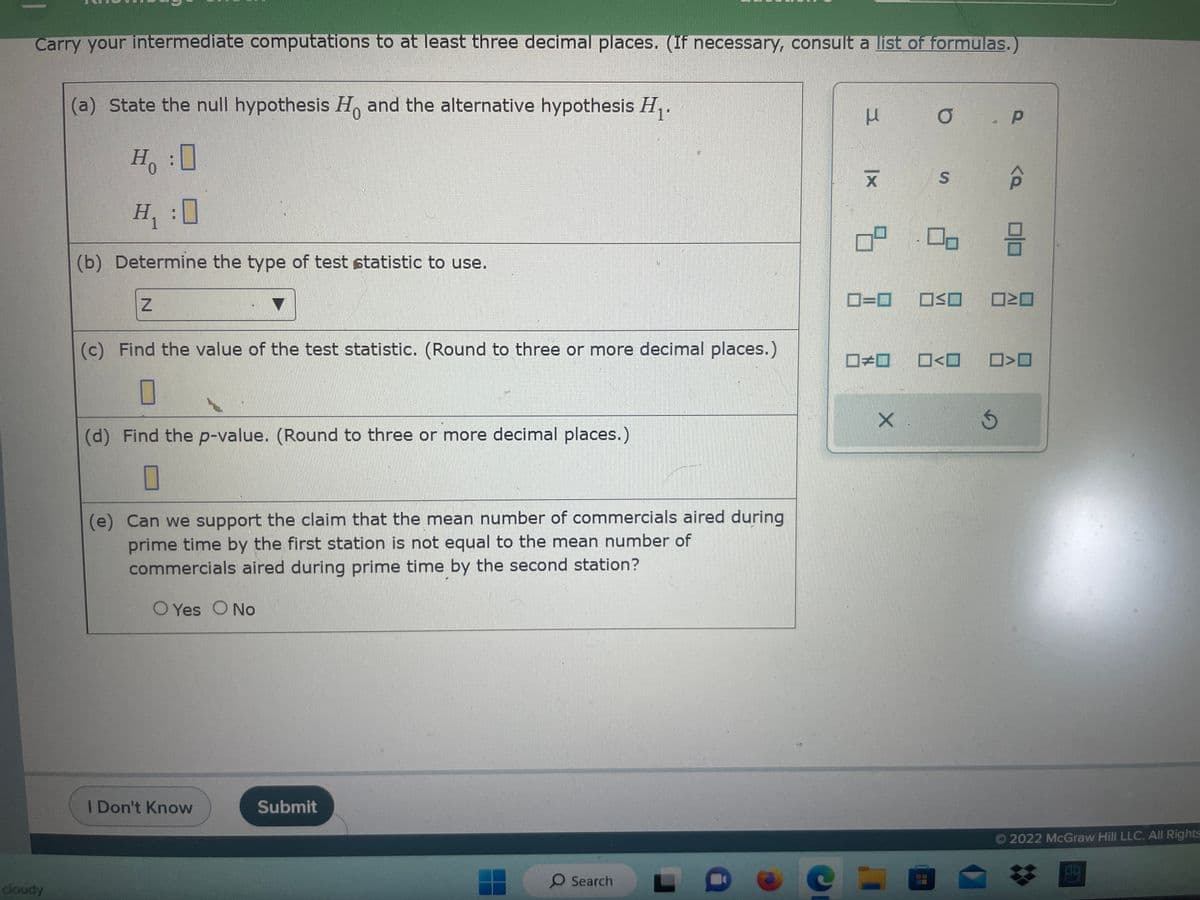
Transcribed Image Text:Carry your intermediate computations to at least three decimal places. (If necessary, consult a list of formulas.)
cloudy
(a) State the null hypothesis Ho and the alternative hypothesis H₁.
Ho :O
0
H₁ :0
(b) Determine the type of test statistic to use.
Z
(c) Find the value of the test statistic. (Round to three or more decimal places.)
(d) Find the p-value. (Round to three or more decimal places.)
0
(e) Can we support the claim that the mean number of commercials aired during
prime time by the first station is not equal to the mean number of
commercials aired during prime time by the second station?
O Yes O No
I Don't Know
Submit
O Search L
e
I
X
5
0=0
#
O. P
S
<
Ś
ê
00
WO
>
Ⓒ2022 McGraw Hill LLC. All Rights
OD
Expert Solution
This question has been solved!
Explore an expertly crafted, step-by-step solution for a thorough understanding of key concepts.

This is a popular solution!

Trending now
This is a popular solution!

Step by step
Solved in 2 steps with 1 images

Recommended textbooks for you
Glencoe Algebra 1, Student Edition, 9780079039897…
Algebra
ISBN:
9780079039897
Author:
Carter
Publisher:
McGraw Hill
Glencoe Algebra 1, Student Edition, 9780079039897…
Algebra
ISBN:
9780079039897
Author:
Carter
Publisher:
McGraw Hill