The HR group for a company collected data detailing the educational level of the company's employees. They found that 155 have no degree (None), 47 have an associate's degree (AA), 213 have a bachelor's degree (BA), 49 have a mas degree (MA), and 33 have PhDs. A frequency/lrelative frequency table is shown below. Complete parts a through c below. Level Frequency None AA BA MA PhD 155 47 213 49 33 Relative 31.19% 9.46% 42.86% 9.86% 6.64% Frequency a) Make a bar chart using counts on the y-axis. Choose the correct bar chart below. OA. OB. Oc. 250 500- 250- 200- 400- 200- 150- 300- 150- 100- 200- 100- 50- 100- 50- 0- None AA BA MA PhD None AA BA MA PhD None AA BA MA PhD b) Make a relative frequency bar chart using percentages on the y-axis. Choose the correct bar chart below. O A. OB. Oc.
The HR group for a company collected data detailing the educational level of the company's employees. They found that 155 have no degree (None), 47 have an associate's degree (AA), 213 have a bachelor's degree (BA), 49 have a mas degree (MA), and 33 have PhDs. A frequency/lrelative frequency table is shown below. Complete parts a through c below. Level Frequency None AA BA MA PhD 155 47 213 49 33 Relative 31.19% 9.46% 42.86% 9.86% 6.64% Frequency a) Make a bar chart using counts on the y-axis. Choose the correct bar chart below. OA. OB. Oc. 250 500- 250- 200- 400- 200- 150- 300- 150- 100- 200- 100- 50- 100- 50- 0- None AA BA MA PhD None AA BA MA PhD None AA BA MA PhD b) Make a relative frequency bar chart using percentages on the y-axis. Choose the correct bar chart below. O A. OB. Oc.

Glencoe Algebra 1, Student Edition, 9780079039897, 0079039898, 2018
18th Edition
ISBN:9780079039897
Author:Carter
Publisher:Carter
Chapter10: Statistics
Section10.6: Summarizing Categorical Data
Problem 23PPS

Related questions
Question
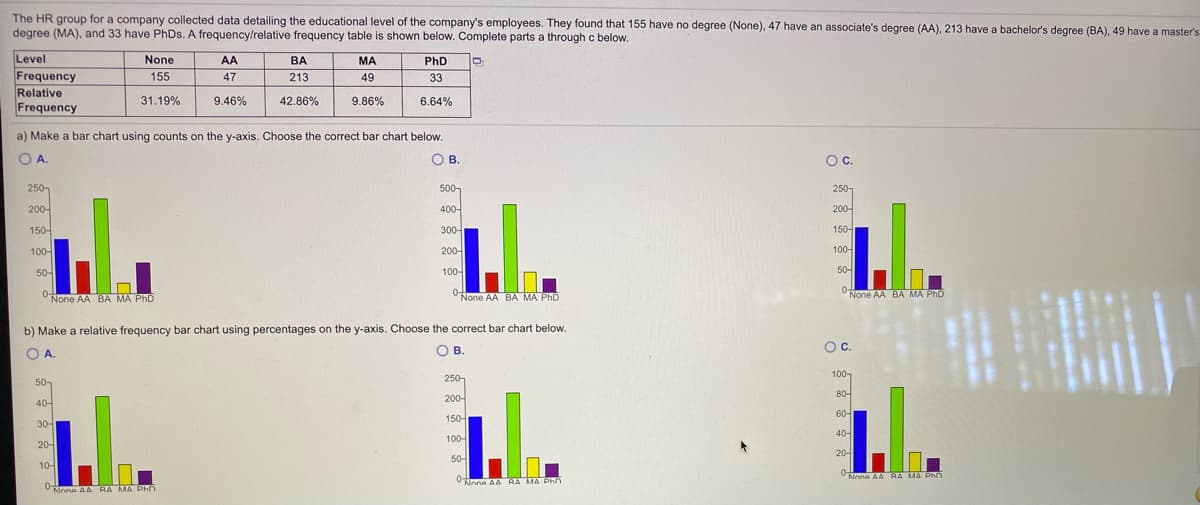
Transcribed Image Text:The HR group for a company collected data detailing the educational level of the company's employees. They found that 155 have no degree (None), 47 have an associate's degree (AA), 213 have a bachelor's degree (BA), 49 have a master's
degree (MA), and 33 have PhDs. A frequency/relative frequency table is shown below. Complete parts a through c below.
Level
Frequency
Relative
Frequency
None
AA
BA
MA
PhD
155
47
213
49
33
31.19%
9.46%
42.86%
9.86%
6.64%
a) Make a bar chart using counts on the y-axis. Choose the correct bar chart below.
OA.
OB.
Oc.
250
500-
250-
200-
400-
200-
150-
300어
150-
100에
200-
100-
50-
100-
50-
0-
None AA BA MA PhD
None AA BA MA PhD
"None AA BA MA PhD
b) Make a relative frequency bar chart using percentages on the y-axis. Choose the correct bar chart below.
O A.
OB.
Oc.
100-
50-
250,
200-
80-
40-
60-
150-
30-
40-
100-
20-
20어
50-
10-
UNone AA RA MA Phn
None AA RA MA Phn
None AA RA MA Ph0
Expert Solution
This question has been solved!
Explore an expertly crafted, step-by-step solution for a thorough understanding of key concepts.

This is a popular solution!

Trending now
This is a popular solution!

Step by step
Solved in 3 steps with 3 images

Knowledge Booster


Learn more about
Need a deep-dive on the concept behind this application? Look no further. Learn more about this topic, statistics and related others by exploring similar questions and additional content below.Recommended textbooks for you
Glencoe Algebra 1, Student Edition, 9780079039897…
Algebra
ISBN:
9780079039897
Author:
Carter
Publisher:
McGraw Hill

Holt Mcdougal Larson Pre-algebra: Student Edition…
Algebra
ISBN:
9780547587776
Author:
HOLT MCDOUGAL
Publisher:
HOLT MCDOUGAL
Glencoe Algebra 1, Student Edition, 9780079039897…
Algebra
ISBN:
9780079039897
Author:
Carter
Publisher:
McGraw Hill
Holt Mcdougal Larson Pre-algebra: Student Edition…
Algebra
ISBN:
9780547587776
Author:
HOLT MCDOUGAL
Publisher:
HOLT MCDOUGAL