The image uploaded is the calculation of Access Bank's Profitability ratios, shorter liquidity ratios, long-term liquidity ratios, and investment ratios for 2020, 2021, 2022. A base year of 2019 was also added. Evaluate the financial performance by comparing the three (3) years' financial performance that is 2020, 2021, and 2022 I have provided in the table with the base year.
The image uploaded is the calculation of Access Bank's Profitability ratios, shorter liquidity ratios, long-term liquidity ratios, and investment ratios for 2020, 2021, 2022. A base year of 2019 was also added. Evaluate the financial performance by comparing the three (3) years' financial performance that is 2020, 2021, and 2022 I have provided in the table with the base year.

Chapter5: Evaluating Operating And Financial Performance
Section: Chapter Questions
Problem 8EP

Related questions
Question
The image uploaded is the calculation of Access Bank's Profitability
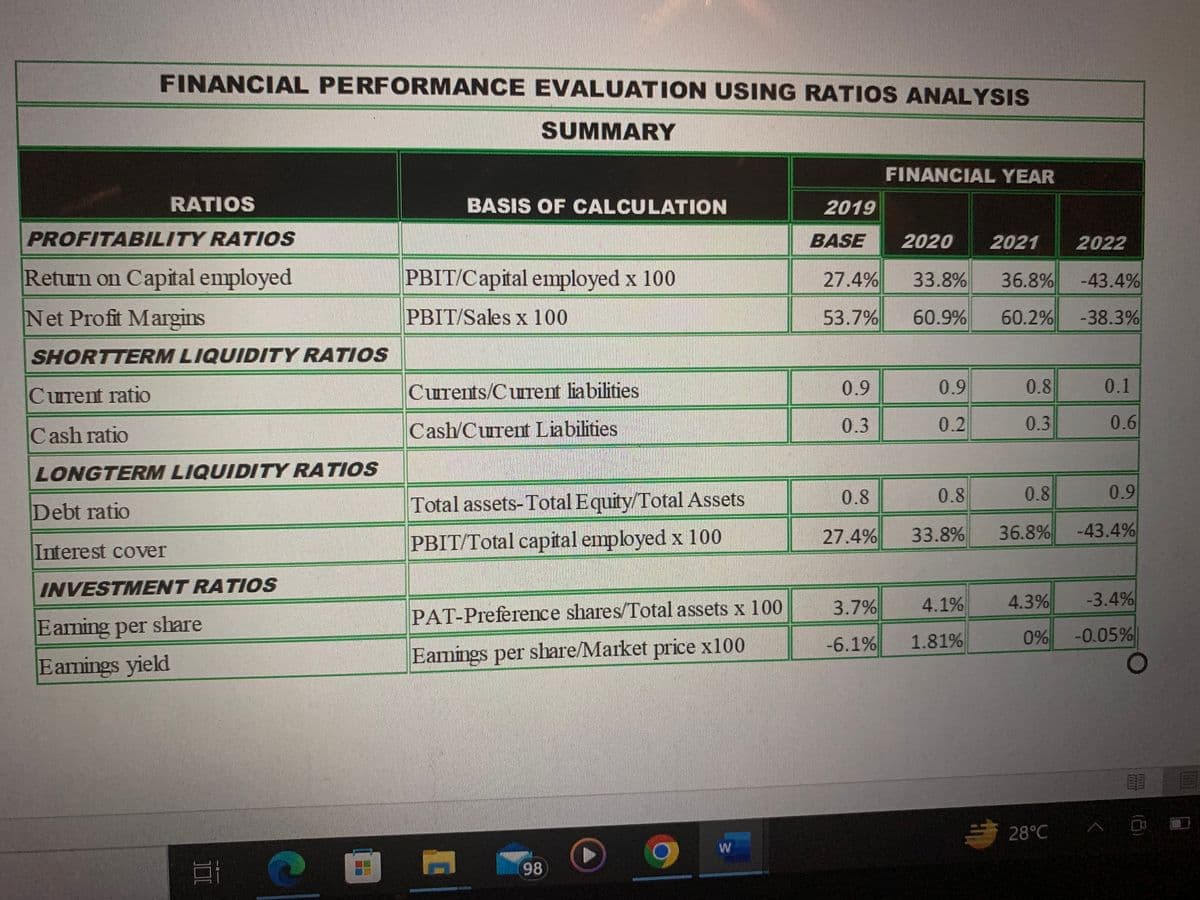
Transcribed Image Text:FINANCIAL PERFORMANCE EVALUATION USING RATIOS ANALYSIS
SUMMARY
RATIOS
PROFITABILITY RATIOS
Return on Capital employed
Net Profit Margins
SHORTTERM LIQUIDITY RATIOS
Current ratio
Cash ratio
LONGTERM LIQUIDITY RATIOS
Debt ratio
Interest cover
INVESTMENT RATIOS
Eaming per share
Eamnings yield
E
C
BASIS OF CALCULATION
PBIT/Capital employed x 100
PBIT/Sales x 100
Currents/Current liabilities
Cash/Current Liabilities
Total assets-Total Equity/Total Assets
PBIT/Total capital employed x 100
PAT-Preference shares/Total assets x 100
Earnings per share/Market price x100
98
W
2019
BASE 2020 2021 2022
-43.4%
-38.3%
FINANCIAL YEAR
27.4% 33.8% 36.8%
53.7%
60.9% 60.2%
0.9
0.3
3.7%
-6.1%
0.9
0.2
0.8
0.8
0.8
27.4% 33.8% 36.8%
0.8
0.3
4.1%
1.81%
4.3%
0.1
28°C
0.6
0.9
-3.4%
0% -0.05%
-43.4%
89
10
Expert Solution
This question has been solved!
Explore an expertly crafted, step-by-step solution for a thorough understanding of key concepts.
Step 1: Introduction of ratio analysis
VIEWStep 2: Evaluating the financial performance by comparing the three years' financial performance
VIEWStep 3: Evaluating the financial performance by comparing the three years' financial performance
VIEWStep 4: Evaluating the financial performance by comparing the three years' financial performance
VIEWSolution
VIEW
Step by step
Solved in 5 steps

Knowledge Booster


Learn more about
Need a deep-dive on the concept behind this application? Look no further. Learn more about this topic, accounting and related others by exploring similar questions and additional content below.Recommended textbooks for you

Survey of Accounting (Accounting I)
Accounting
ISBN:
9781305961883
Author:
Carl Warren
Publisher:
Cengage Learning

EBK CONTEMPORARY FINANCIAL MANAGEMENT
Finance
ISBN:
9781337514835
Author:
MOYER
Publisher:
CENGAGE LEARNING - CONSIGNMENT
Survey of Accounting (Accounting I)
Accounting
ISBN:
9781305961883
Author:
Carl Warren
Publisher:
Cengage Learning
EBK CONTEMPORARY FINANCIAL MANAGEMENT
Finance
ISBN:
9781337514835
Author:
MOYER
Publisher:
CENGAGE LEARNING - CONSIGNMENT
Century 21 Accounting Multicolumn Journal
Accounting
ISBN:
9781337679503
Author:
Gilbertson
Publisher:
Cengage

Cornerstones of Financial Accounting
Accounting
ISBN:
9781337690881
Author:
Jay Rich, Jeff Jones
Publisher:
Cengage Learning

Intermediate Financial Management (MindTap Course…
Finance
ISBN:
9781337395083
Author:
Eugene F. Brigham, Phillip R. Daves
Publisher:
Cengage Learning