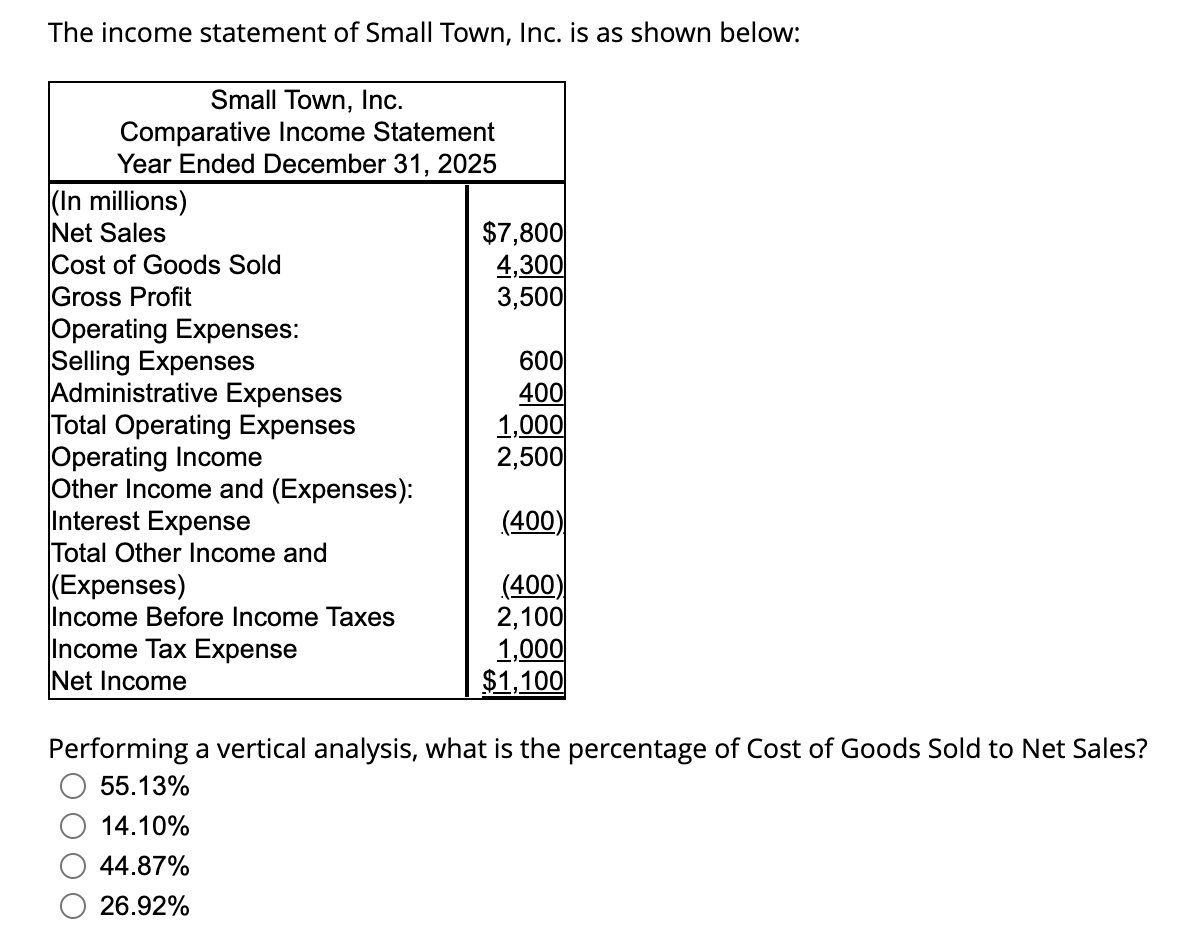
The income statement of Small Town, Inc. is as shown below: Small Town, Inc. Comparative Income Statement Year Ended December 31, 2025 (In millions) Net Sales Cost of Goods Sold Gross Profit Operating Expenses: Selling Expenses Administrative Expenses Total Operating Expenses Operating Income Other Income and (Expenses): Interest Expense Total Other Income and (Expenses) Income Before Income Taxes Income Tax Expense Net Income $7,800 4,300 3,500 600 400 1,000 2,500 (400) (400) 2,100 1,000 $1,100 Performing a vertical analysis, what is the percentage of Cost of Goods Sold to Net Sales? 55.13% 14.10% 44.87% 26.92%
The income statement of Small Town, Inc. is as shown below: Small Town, Inc. Comparative Income Statement Year Ended December 31, 2025 (In millions) Net Sales Cost of Goods Sold Gross Profit Operating Expenses: Selling Expenses Administrative Expenses Total Operating Expenses Operating Income Other Income and (Expenses): Interest Expense Total Other Income and (Expenses) Income Before Income Taxes Income Tax Expense Net Income $7,800 4,300 3,500 600 400 1,000 2,500 (400) (400) 2,100 1,000 $1,100 Performing a vertical analysis, what is the percentage of Cost of Goods Sold to Net Sales? 55.13% 14.10% 44.87% 26.92%

Managerial Accounting: The Cornerstone of Business Decision-Making
7th Edition
ISBN:9781337115773
Author:Maryanne M. Mowen, Don R. Hansen, Dan L. Heitger
Publisher:Maryanne M. Mowen, Don R. Hansen, Dan L. Heitger
Chapter15: Financial Statement Analysis
Section: Chapter Questions
Problem 40E: Cuneo Companys income statements for the last 3 years are as follows: Refer to the information for...

Related questions
Question
100%
36. Help me selecting the right answer. Thank you
Transcribed Image Text:The income statement of Small Town, Inc. is as shown below:
Small Town, Inc.
Comparative Income Statement
Year Ended December 31, 2025
(In millions)
Net Sales
Cost of Goods Sold
Gross Profit
Operating Expenses:
Selling Expenses
Administrative Expenses
Total Operating Expenses
Operating Income
Other Income and (Expenses):
Interest Expense
Total Other Income and
(Expenses)
Income Before Income Taxes
Income Tax Expense
Net Income
$7,800
4,300
3,500
600
400
1,000
2,500
(400)
(400)
2,100
1,000
$1,100
Performing a vertical analysis, what is the percentage of Cost of Goods Sold to Net Sales?
55.13%
14.10%
44.87%
26.92%
Expert Solution
This question has been solved!
Explore an expertly crafted, step-by-step solution for a thorough understanding of key concepts.

This is a popular solution!

Trending now
This is a popular solution!

Step by step
Solved in 2 steps

Knowledge Booster


Learn more about
Need a deep-dive on the concept behind this application? Look no further. Learn more about this topic, accounting and related others by exploring similar questions and additional content below.Recommended textbooks for you
Managerial Accounting: The Cornerstone of Busines…
Accounting
ISBN:
9781337115773
Author:
Maryanne M. Mowen, Don R. Hansen, Dan L. Heitger
Publisher:
Cengage Learning


Intermediate Accounting: Reporting And Analysis
Accounting
ISBN:
9781337788281
Author:
James M. Wahlen, Jefferson P. Jones, Donald Pagach
Publisher:
Cengage Learning
Managerial Accounting: The Cornerstone of Busines…
Accounting
ISBN:
9781337115773
Author:
Maryanne M. Mowen, Don R. Hansen, Dan L. Heitger
Publisher:
Cengage Learning
Intermediate Accounting: Reporting And Analysis
Accounting
ISBN:
9781337788281
Author:
James M. Wahlen, Jefferson P. Jones, Donald Pagach
Publisher:
Cengage Learning

Cornerstones of Financial Accounting
Accounting
ISBN:
9781337690881
Author:
Jay Rich, Jeff Jones
Publisher:
Cengage Learning

Financial Accounting
Accounting
ISBN:
9781305088436
Author:
Carl Warren, Jim Reeve, Jonathan Duchac
Publisher:
Cengage Learning

Financial Accounting
Accounting
ISBN:
9781337272124
Author:
Carl Warren, James M. Reeve, Jonathan Duchac
Publisher:
Cengage Learning