The independent cases are listed below includes all balance sheet accounts related to operating activities Net income Depreciation expense Accounts receivable increase (decrease) 114,000 (207,000 (27,000) Inventory increase (decrease) Accounts payable increase (decrease) Accrued liabilities increase (decrease) Case C $317,000 18,500 $427,000 87,000 Case A 47,000 (57,000) Case B 157,000 42,000 57,000 77,000 (57,000) 127,000 67,000 (227,000 (47,000) Show the operating activities section of cash flows for each of the given cases. (Amounts to be deducted should be indicated with a minus sign.) Case A Case B Case C Net Income Adjustments to Reconcile Net Income to Net Cash Provided by Operating Activities Depreciation Changes in Assets and Liabilities Accounts Receivable Inventory Accounts Payable Accrued Liabilities Net Cash Provided by Operating Activities
The independent cases are listed below includes all balance sheet accounts related to operating activities Net income Depreciation expense Accounts receivable increase (decrease) 114,000 (207,000 (27,000) Inventory increase (decrease) Accounts payable increase (decrease) Accrued liabilities increase (decrease) Case C $317,000 18,500 $427,000 87,000 Case A 47,000 (57,000) Case B 157,000 42,000 57,000 77,000 (57,000) 127,000 67,000 (227,000 (47,000) Show the operating activities section of cash flows for each of the given cases. (Amounts to be deducted should be indicated with a minus sign.) Case A Case B Case C Net Income Adjustments to Reconcile Net Income to Net Cash Provided by Operating Activities Depreciation Changes in Assets and Liabilities Accounts Receivable Inventory Accounts Payable Accrued Liabilities Net Cash Provided by Operating Activities

Chapter1: Financial Statements And Business Decisions
Section: Chapter Questions
Problem 1Q

Related questions
Question
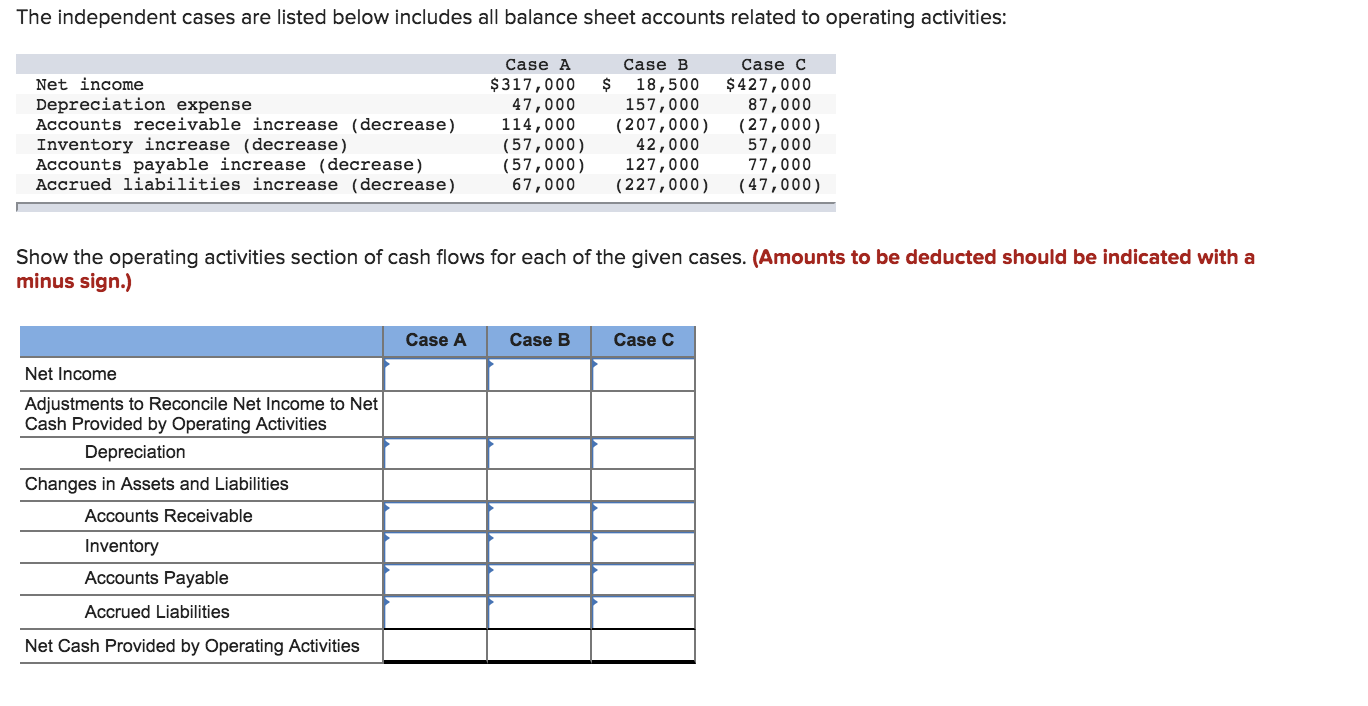
Transcribed Image Text:The independent cases are listed below includes all balance sheet accounts related to operating activities
Net income
Depreciation expense
Accounts receivable increase (decrease) 114,000 (207,000 (27,000)
Inventory increase (decrease)
Accounts payable increase (decrease)
Accrued liabilities increase (decrease)
Case C
$317,000 18,500 $427,000
87,000
Case A
47,000
(57,000)
Case B
157,000
42,000
57,000
77,000
(57,000) 127,000
67,000 (227,000 (47,000)
Show the operating activities section of cash flows for each of the given cases. (Amounts to be deducted should be indicated with a
minus sign.)
Case A
Case B
Case C
Net Income
Adjustments to Reconcile Net Income to Net
Cash Provided by Operating Activities
Depreciation
Changes in Assets and Liabilities
Accounts Receivable
Inventory
Accounts Payable
Accrued Liabilities
Net Cash Provided by Operating Activities
Expert Solution
This question has been solved!
Explore an expertly crafted, step-by-step solution for a thorough understanding of key concepts.

This is a popular solution!

Trending now
This is a popular solution!

Step by step
Solved in 3 steps with 2 images

Recommended textbooks for you

Accounting
Accounting
ISBN:
9781337272094
Author:
WARREN, Carl S., Reeve, James M., Duchac, Jonathan E.
Publisher:
Cengage Learning,

Accounting Information Systems
Accounting
ISBN:
9781337619202
Author:
Hall, James A.
Publisher:
Cengage Learning,
Accounting
Accounting
ISBN:
9781337272094
Author:
WARREN, Carl S., Reeve, James M., Duchac, Jonathan E.
Publisher:
Cengage Learning,
Accounting Information Systems
Accounting
ISBN:
9781337619202
Author:
Hall, James A.
Publisher:
Cengage Learning,

Horngren's Cost Accounting: A Managerial Emphasis…
Accounting
ISBN:
9780134475585
Author:
Srikant M. Datar, Madhav V. Rajan
Publisher:
PEARSON

Intermediate Accounting
Accounting
ISBN:
9781259722660
Author:
J. David Spiceland, Mark W. Nelson, Wayne M Thomas
Publisher:
McGraw-Hill Education

Financial and Managerial Accounting
Accounting
ISBN:
9781259726705
Author:
John J Wild, Ken W. Shaw, Barbara Chiappetta Fundamental Accounting Principles
Publisher:
McGraw-Hill Education