The Institute of Education Sciences measures the high school dropout rate as the percentage of 16- through 24-year-olds who are not enrolled in school and have not earned a high school credential. In 2009, the high school dropout rate was 8.1%. A polling company recently took a survey of 1000 people between the ages of 16 and 24 and found 6.5% of them are high school dropouts. The polling company would like to determine whether the dropout rate has decreased. At a 5% significance level, the p-value is
The Institute of Education Sciences measures the high school dropout rate as the percentage of 16- through 24-year-olds who are not enrolled in school and have not earned a high school credential. In 2009, the high school dropout rate was 8.1%. A polling company recently took a survey of 1000 people between the ages of 16 and 24 and found 6.5% of them are high school dropouts. The polling company would like to determine whether the dropout rate has decreased. At a 5% significance level, the p-value is

Holt Mcdougal Larson Pre-algebra: Student Edition 2012
1st Edition
ISBN:9780547587776
Author:HOLT MCDOUGAL
Publisher:HOLT MCDOUGAL
Chapter11: Data Analysis And Probability
Section11.4: Collecting Data
Problem 7E

Related questions
Question
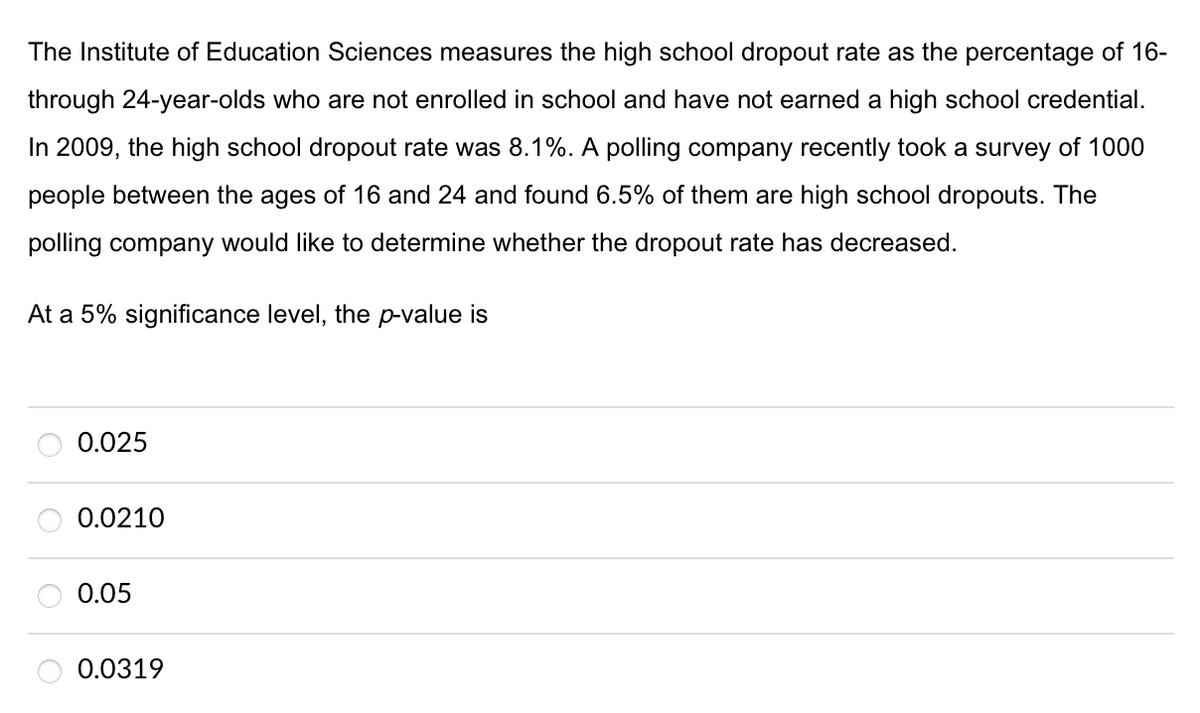
Transcribed Image Text:The Institute of Education Sciences measures the high school dropout rate as the percentage of 16-
through 24-year-olds who are not enrolled in school and have not earned a high school credential.
In 2009, the high school dropout rate was 8.1%. A polling company recently took a survey of 1000
people between the ages of 16 and 24 and found 6.5% of them are high school dropouts. The
polling company would like to determine whether the dropout rate has decreased.
At a 5% significance level, the p-value is
0.025
0.0210
0.05
0.0319
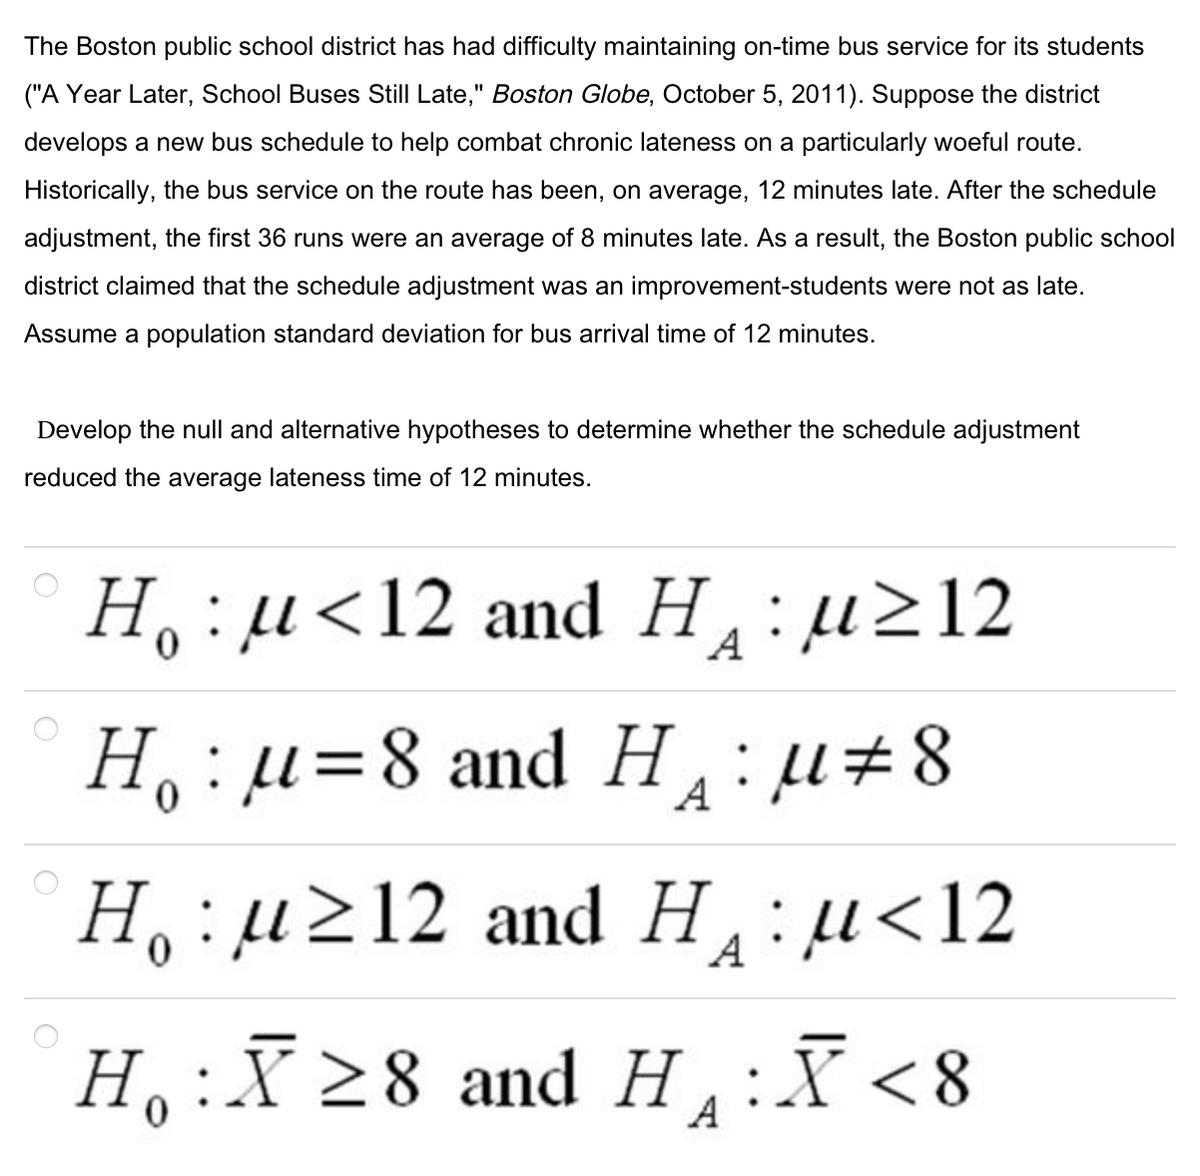
Transcribed Image Text:The Boston public school district has had difficulty maintaining on-time bus service for its students
("A Year Later, School Buses Still Late," Boston Globe, October 5, 2011). Suppose the district
develops a new bus schedule to help combat chronic lateness on a particularly woeful route.
Historically, the bus service on the route has been, on average, 12 minutes late. After the schedule
adjustment, the first 36 runs were an average of 8 minutes late. As a result, the Boston public school
district claimed that the schedule adjustment was an improvement-students were not as late.
Assume a population standard deviation for bus arrival time of 12 minutes.
Develop the null and alternative hypotheses to determine whether the schedule adjustment
reduced the average lateness time of 12 minutes.
H,:µ<12 and H:µ212
A
H, :µ=8 and H
:µ±8
A
H, :µ>12 and H: µ<12
H :X 28 and H:X <8
A
Expert Solution
This question has been solved!
Explore an expertly crafted, step-by-step solution for a thorough understanding of key concepts.

This is a popular solution!

Trending now
This is a popular solution!

Step by step
Solved in 2 steps with 1 images

Recommended textbooks for you
Holt Mcdougal Larson Pre-algebra: Student Edition…
Algebra
ISBN:
9780547587776
Author:
HOLT MCDOUGAL
Publisher:
HOLT MCDOUGAL

Holt Mcdougal Larson Pre-algebra: Student Edition…
Algebra
ISBN:
9780547587776
Author:
HOLT MCDOUGAL
Publisher:
HOLT MCDOUGAL