The Institute of Education Sciences measures the high school dropout rate as the percentage of 16- through 24-year-olds who are not enrolled in school and have not earned a high school credential. In 2009, the high school dropout rate was 8.1%. A polling company recently took a survey of 1000 people between the ages of 16 and 24 and found 6.5% of them are high school dropouts. The polling company would like to determine whether the dropout rate has decreased. At a 5% significance level, the p-value 0.025 0.0210 0.05 0.0319
The Institute of Education Sciences measures the high school dropout rate as the percentage of 16- through 24-year-olds who are not enrolled in school and have not earned a high school credential. In 2009, the high school dropout rate was 8.1%. A polling company recently took a survey of 1000 people between the ages of 16 and 24 and found 6.5% of them are high school dropouts. The polling company would like to determine whether the dropout rate has decreased. At a 5% significance level, the p-value 0.025 0.0210 0.05 0.0319

Holt Mcdougal Larson Pre-algebra: Student Edition 2012
1st Edition
ISBN:9780547587776
Author:HOLT MCDOUGAL
Publisher:HOLT MCDOUGAL
Chapter11: Data Analysis And Probability
Section11.4: Collecting Data
Problem 7E

Related questions
Question
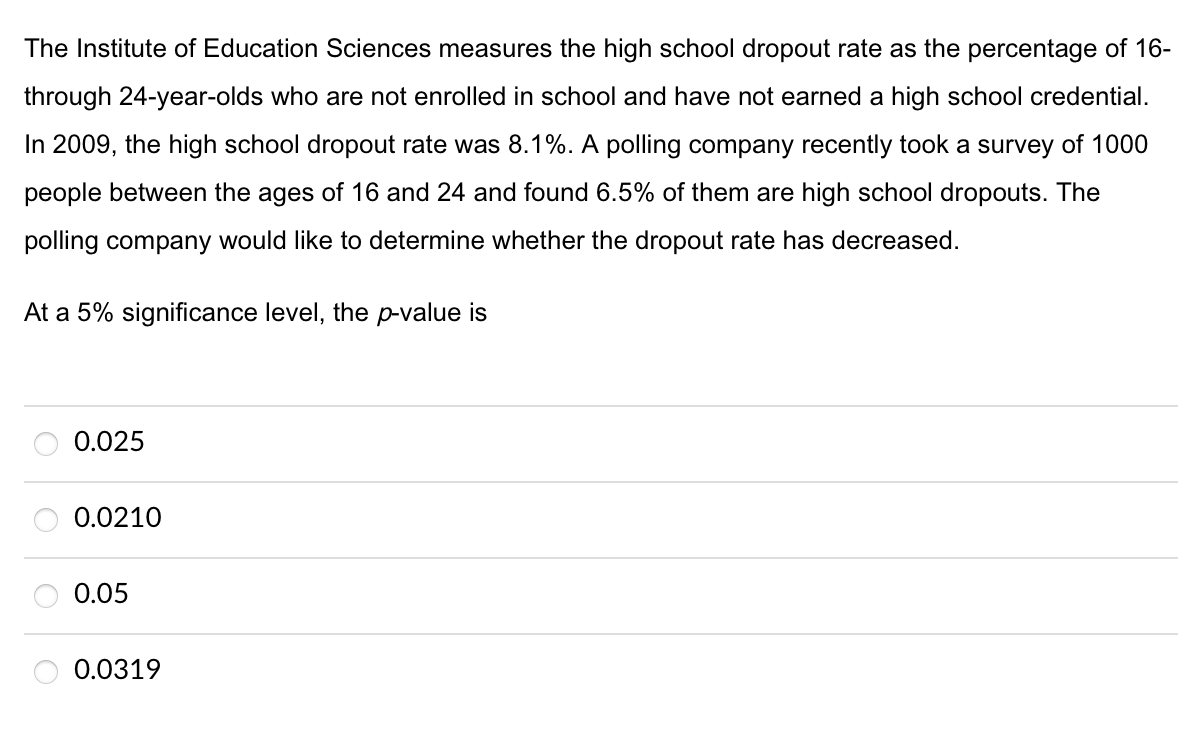
Transcribed Image Text:The Institute of Education Sciences measures the high school dropout rate as the percentage of 16-
through 24-year-olds who are not enrolled in school and have not earned a high school credential.
In 2009, the high school dropout rate was 8.1%. A polling company recently took a survey of 1000
people between the ages of 16 and 24 and found 6.5% of them are high school dropouts. The
polling company would like to determine whether the dropout rate has decreased.
At a 5% significance level, the p-value is
0.025
0.0210
0.05
0.0319
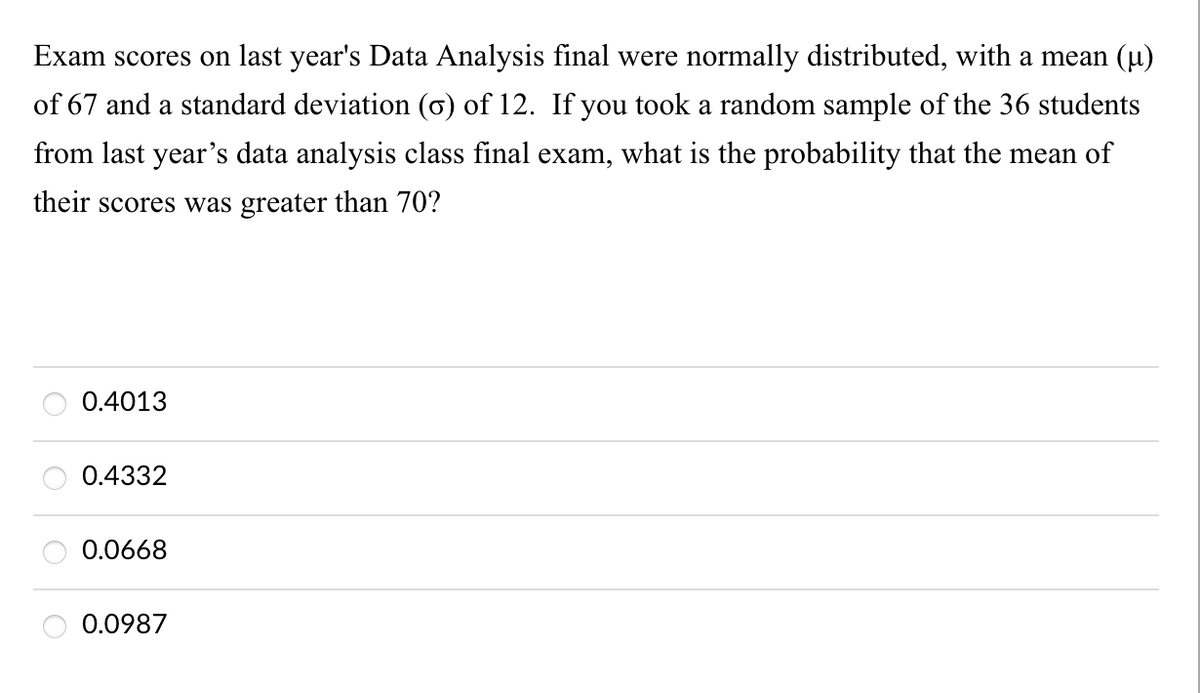
Transcribed Image Text:Exam scores on last year's Data Analysis final were normally distributed, with a mean (u)
of 67 and a standard deviation (6) of 12. If you took a random sample of the 36 students
from last year's data analysis class final exam, what is the probability that the mean of
their scores was greater than 70?
0.4013
0.4332
0.0668
0.0987
Expert Solution
This question has been solved!
Explore an expertly crafted, step-by-step solution for a thorough understanding of key concepts.

This is a popular solution!

Trending now
This is a popular solution!

Step by step
Solved in 2 steps

Recommended textbooks for you
Holt Mcdougal Larson Pre-algebra: Student Edition…
Algebra
ISBN:
9780547587776
Author:
HOLT MCDOUGAL
Publisher:
HOLT MCDOUGAL

Holt Mcdougal Larson Pre-algebra: Student Edition…
Algebra
ISBN:
9780547587776
Author:
HOLT MCDOUGAL
Publisher:
HOLT MCDOUGAL