The last 15 months of sales data are given below: Jan Feb Mar Apr May 2020 13.7 14.7 14.8 13 14 2021 16.9 16.3 14.7 Xt represents sales in month t. Let Yt = log (xt) and let Zt Yt - Yt-12. Then the following model was fitted: Zt = 0.52Zt-1 +0.38Zt-2 + Et where Et is white noise. c. Compute the forecasts for Xt for April 2021 and May 2021. Jun Jul Aug Sep 13.4 13.6 14.9 13.5 Oct Nov Dec 14.7 15.7 21.9
The last 15 months of sales data are given below: Jan Feb Mar Apr May 2020 13.7 14.7 14.8 13 14 2021 16.9 16.3 14.7 Xt represents sales in month t. Let Yt = log (xt) and let Zt Yt - Yt-12. Then the following model was fitted: Zt = 0.52Zt-1 +0.38Zt-2 + Et where Et is white noise. c. Compute the forecasts for Xt for April 2021 and May 2021. Jun Jul Aug Sep 13.4 13.6 14.9 13.5 Oct Nov Dec 14.7 15.7 21.9

Chapter6: Exponential And Logarithmic Functions
Section6.8: Fitting Exponential Models To Data
Problem 3TI: Table 6 shows the population, in thousands, of harbor seals in the Wadden Sea over the years 1997 to...

Related questions
Question
100%
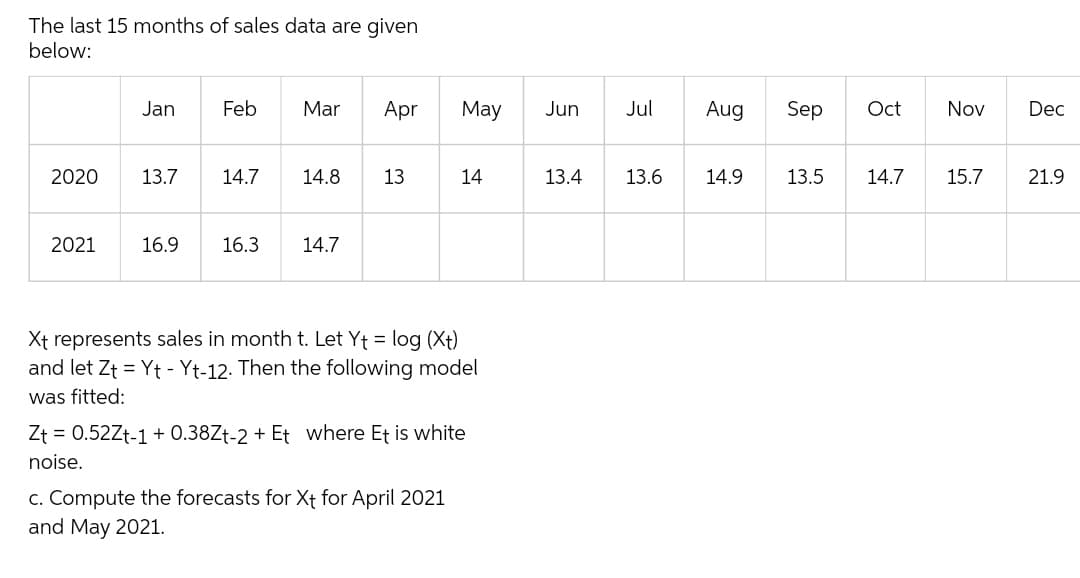
Transcribed Image Text:The last 15 months of sales data are given
below:
Jan
Feb
Mar Apr
May
2020
13.7
14.7
14.8 13
14
2021
16.9 16.3 14.7
Xt represents sales in month t. Let Yt = log (xt)
and let Zt = Yt - Yt-12. Then the following model
was fitted:
Zt = 0.52Zt-1 +0.38Zt-2 + Et where Et is white
noise.
c. Compute the forecasts for Xt for April 2021
and May 2021.
Jun Jul
13.4 13.6
Aug
14.9
Sep
13.5
Oct Nov Dec
14.7
15.7
21.9
Expert Solution
This question has been solved!
Explore an expertly crafted, step-by-step solution for a thorough understanding of key concepts.

This is a popular solution!

Trending now
This is a popular solution!

Step by step
Solved in 3 steps

Recommended textbooks for you

Algebra & Trigonometry with Analytic Geometry
Algebra
ISBN:
9781133382119
Author:
Swokowski
Publisher:
Cengage
Algebra & Trigonometry with Analytic Geometry
Algebra
ISBN:
9781133382119
Author:
Swokowski
Publisher:
Cengage