The least-squares regression equation is y = 618.4x + 17,572 where y is the median income and x is the percentage of 25 years and older with at least a bachelor's degree in the region. The scatter diagram indicates a linear relation between the two variables with a correlation coefficient of 0.6761. Complete parts (a) through (d). 55000 20000 15 20 25 30 35 40 45 50 55 60 Bachelor's % (a) Predict the median income of a region in which 25% of adults 25 years and older have at least a bachelor's degree. $ (Round to the nearest dollar as needed.) (b) In a particular region, 29.2 percent of adults 25 years and older, have at least a bachelor's degree. The median income in this region $38,940. Is this income higher than what you would expect? Why? This is V than expected because the expected income is $ (Round to the nearest dollar as needed.) (c) Interpret the slope. Select the correct choice below and fill in the answer box to complete your choice. (Type an integer or decimal. Do not round.) O A. For a median income of $o, the percent of adults with a bachelor's degree is % O B. For 0% of adults having a bachelor's degree, the median income is predicted to be $. O C. For every dollar increase in median income, the percent of adults having at least a bachelor's degree is %, on average. O D. For every percent increase in adults having at least a bachelor's degree, the median income increases by $. on average. (d) Explain why it does not make sense to interpret the y-intercept. Choose the correct answer below. O A. It does not make sense to interpret the y-intercept because an x-value of 0 is outside the scope of the model. O B. It does not make sense interpret the y-intercept because a y-value of 0 is outside the scope of the model. of 0 does pot make sens
The least-squares regression equation is y = 618.4x + 17,572 where y is the median income and x is the percentage of 25 years and older with at least a bachelor's degree in the region. The scatter diagram indicates a linear relation between the two variables with a correlation coefficient of 0.6761. Complete parts (a) through (d). 55000 20000 15 20 25 30 35 40 45 50 55 60 Bachelor's % (a) Predict the median income of a region in which 25% of adults 25 years and older have at least a bachelor's degree. $ (Round to the nearest dollar as needed.) (b) In a particular region, 29.2 percent of adults 25 years and older, have at least a bachelor's degree. The median income in this region $38,940. Is this income higher than what you would expect? Why? This is V than expected because the expected income is $ (Round to the nearest dollar as needed.) (c) Interpret the slope. Select the correct choice below and fill in the answer box to complete your choice. (Type an integer or decimal. Do not round.) O A. For a median income of $o, the percent of adults with a bachelor's degree is % O B. For 0% of adults having a bachelor's degree, the median income is predicted to be $. O C. For every dollar increase in median income, the percent of adults having at least a bachelor's degree is %, on average. O D. For every percent increase in adults having at least a bachelor's degree, the median income increases by $. on average. (d) Explain why it does not make sense to interpret the y-intercept. Choose the correct answer below. O A. It does not make sense to interpret the y-intercept because an x-value of 0 is outside the scope of the model. O B. It does not make sense interpret the y-intercept because a y-value of 0 is outside the scope of the model. of 0 does pot make sens

Functions and Change: A Modeling Approach to College Algebra (MindTap Course List)
6th Edition
ISBN:9781337111348
Author:Bruce Crauder, Benny Evans, Alan Noell
Publisher:Bruce Crauder, Benny Evans, Alan Noell
Chapter3: Straight Lines And Linear Functions
Section3.CR: Chapter Review Exercises
Problem 15CR: Life Expectancy The following table shows the average life expectancy, in years, of a child born in...

Related questions
Question
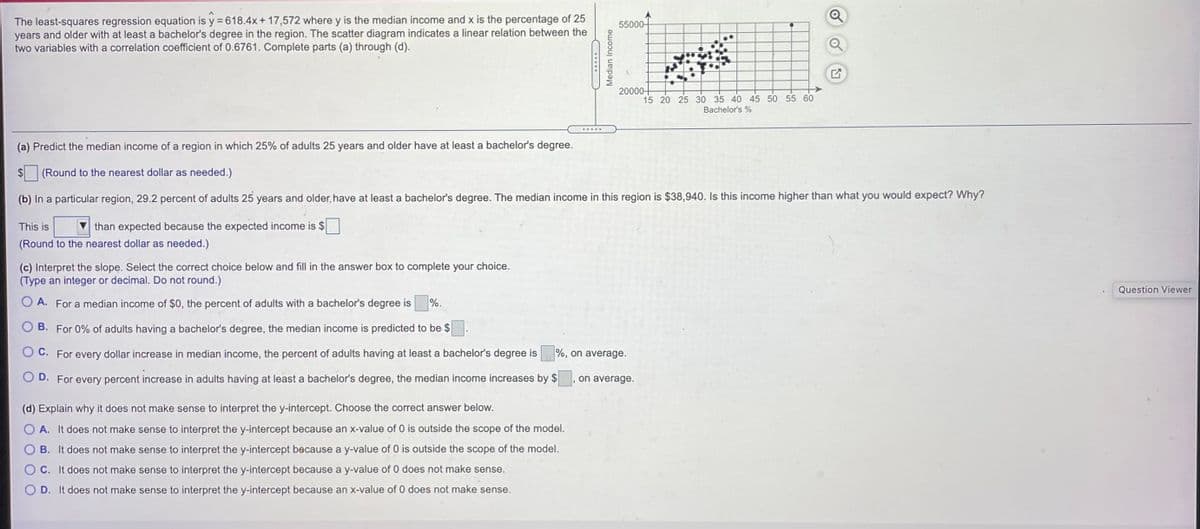
Transcribed Image Text:The least-squares regression equation is y = 618.4x+ 17,572 where y is the median income and x is the percentage of 25
years and older with at least a bachelor's degree in the region. The scatter diagram indicates a linear relation between the
two variables with a correlation coefficient of 0.6761. Complete parts (a) through (d).
55000-
20000-
15 20 25 30 35 40 45 50 55 60
Bachelor's %
.....
(a) Predict the median income of a region in which 25% of adults 25 years and older have at least a bachelor's degree.
(Round to the nearest dollar as needed.)
(b) In a particular region, 29.2 percent of adults 25 years and older, have at least a bachelor's degree. The median income in this region is $38,940. Is this income higher than what you would expect? Why?
This is
than expected because the expected income is $
(Round to the nearest dollar as needed.)
(c) Interpret the slope. Select the correct choice below and fill in the answer box to complete your choice.
(Type an integer or decimal. Do not round.)
Question Viewer
O A. For a median income of $0, the percent of adults with a bachelor's degree is
%.
O B. For 0% of adults having a bachelor's degree, the median income is predicted to be $
C. For every dollar increase in median income, the percent of adults having at least a bachelor's degree is
%, on average.
D. For every percent increase in adults having at least a bachelor's degree, the median income increases by $, on average.
(d) Explain why it does not make sense to interpret the y-intercept. Choose the correct answer below.
O A. It does not make sense to interpret the y-intercept because an x-value of 0 is outside the scope of the model.
B. It does not make sense to interpret the y-intercept because a y-value of 0 is outside the scope of the model.
C. It does not make sense to interpret the y-intercept because a y-value of 0 does not make sense.
D. It does not make sense to interpret the y-intercept because an x-value of 0 does not make sense.
Median Income
Expert Solution
This question has been solved!
Explore an expertly crafted, step-by-step solution for a thorough understanding of key concepts.

This is a popular solution!

Trending now
This is a popular solution!

Step by step
Solved in 2 steps

Recommended textbooks for you
Functions and Change: A Modeling Approach to Coll…
Algebra
ISBN:
9781337111348
Author:
Bruce Crauder, Benny Evans, Alan Noell
Publisher:
Cengage Learning

Elementary Linear Algebra (MindTap Course List)
Algebra
ISBN:
9781305658004
Author:
Ron Larson
Publisher:
Cengage Learning

College Algebra
Algebra
ISBN:
9781305115545
Author:
James Stewart, Lothar Redlin, Saleem Watson
Publisher:
Cengage Learning
Functions and Change: A Modeling Approach to Coll…
Algebra
ISBN:
9781337111348
Author:
Bruce Crauder, Benny Evans, Alan Noell
Publisher:
Cengage Learning
Elementary Linear Algebra (MindTap Course List)
Algebra
ISBN:
9781305658004
Author:
Ron Larson
Publisher:
Cengage Learning
College Algebra
Algebra
ISBN:
9781305115545
Author:
James Stewart, Lothar Redlin, Saleem Watson
Publisher:
Cengage Learning


Glencoe Algebra 1, Student Edition, 9780079039897…
Algebra
ISBN:
9780079039897
Author:
Carter
Publisher:
McGraw Hill

Algebra & Trigonometry with Analytic Geometry
Algebra
ISBN:
9781133382119
Author:
Swokowski
Publisher:
Cengage