The line graph shows the price per share of stock for a certain company from May 2012 to December 2012. Estimate the opening price per share in May 2012. The price per share in May was approximately $ Price per share ($) 50- 40- 30- 20- 10- 0- May (Round to the nearest dollar as needed.) Stock Performance June July Aug. Sept. Oct. Nov. Month Dec. N
The line graph shows the price per share of stock for a certain company from May 2012 to December 2012. Estimate the opening price per share in May 2012. The price per share in May was approximately $ Price per share ($) 50- 40- 30- 20- 10- 0- May (Round to the nearest dollar as needed.) Stock Performance June July Aug. Sept. Oct. Nov. Month Dec. N

Glencoe Algebra 1, Student Edition, 9780079039897, 0079039898, 2018
18th Edition
ISBN:9780079039897
Author:Carter
Publisher:Carter
Chapter3: Linear And Nonlinear Functions
Section3.7: Piecewise And Step Functions
Problem 29PPS

Related questions
Question
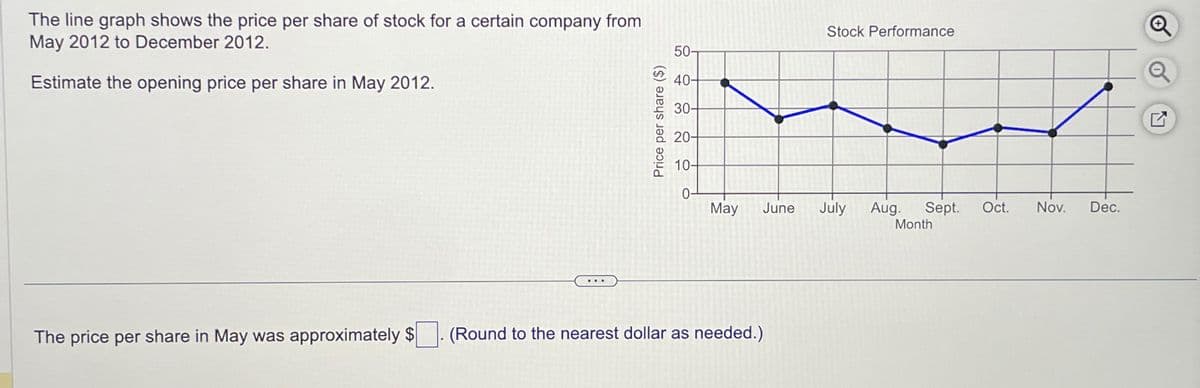
Transcribed Image Text:The line graph shows the price per share of stock for a certain company from
May 2012 to December 2012.
Estimate the opening price per share in May 2012.
The price per share in May was approximately $
Price per share ($)
50-
40-
30-
20-
10-
0-
May
(Round to the nearest dollar as needed.)
Stock Performance
June July Aug. Sept. Oct. Nov.
Month
Dec.
N
Expert Solution
This question has been solved!
Explore an expertly crafted, step-by-step solution for a thorough understanding of key concepts.

This is a popular solution!

Trending now
This is a popular solution!

Step by step
Solved in 2 steps

Recommended textbooks for you
Glencoe Algebra 1, Student Edition, 9780079039897…
Algebra
ISBN:
9780079039897
Author:
Carter
Publisher:
McGraw Hill

Holt Mcdougal Larson Pre-algebra: Student Edition…
Algebra
ISBN:
9780547587776
Author:
HOLT MCDOUGAL
Publisher:
HOLT MCDOUGAL

Glencoe Algebra 1, Student Edition, 9780079039897…
Algebra
ISBN:
9780079039897
Author:
Carter
Publisher:
McGraw Hill
Holt Mcdougal Larson Pre-algebra: Student Edition…
Algebra
ISBN:
9780547587776
Author:
HOLT MCDOUGAL
Publisher:
HOLT MCDOUGAL

Algebra: Structure And Method, Book 1
Algebra
ISBN:
9780395977224
Author:
Richard G. Brown, Mary P. Dolciani, Robert H. Sorgenfrey, William L. Cole
Publisher:
McDougal Littell