The linear regression equation for predicting systolic blood pressure from age is as follows: y = 53 + 1x. Find the residual for a person who is 22 years of age with a systolic blood pressure of 75.6.
The linear regression equation for predicting systolic blood pressure from age is as follows: y = 53 + 1x. Find the residual for a person who is 22 years of age with a systolic blood pressure of 75.6.

Chapter6: Exponential And Logarithmic Functions
Section6.7: Exponential And Logarithmic Models
Problem 19TI: Does a linear, exponential, or logarithmic model best fit the data in Table 2? Find the model.

Related questions
Question
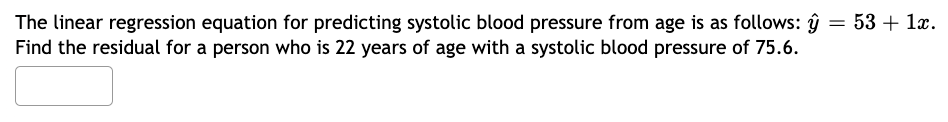
Transcribed Image Text:The linear regression equation for predicting systolic blood pressure from age is as follows: y = 53 + 1x.
Find the residual for a person who is 22 years of age with a systolic blood pressure of 75.6.
Expert Solution
This question has been solved!
Explore an expertly crafted, step-by-step solution for a thorough understanding of key concepts.

This is a popular solution!

Trending now
This is a popular solution!

Step by step
Solved in 2 steps

Recommended textbooks for you

Functions and Change: A Modeling Approach to Coll…
Algebra
ISBN:
9781337111348
Author:
Bruce Crauder, Benny Evans, Alan Noell
Publisher:
Cengage Learning

Glencoe Algebra 1, Student Edition, 9780079039897…
Algebra
ISBN:
9780079039897
Author:
Carter
Publisher:
McGraw Hill
Functions and Change: A Modeling Approach to Coll…
Algebra
ISBN:
9781337111348
Author:
Bruce Crauder, Benny Evans, Alan Noell
Publisher:
Cengage Learning
Glencoe Algebra 1, Student Edition, 9780079039897…
Algebra
ISBN:
9780079039897
Author:
Carter
Publisher:
McGraw Hill

Trigonometry (MindTap Course List)
Trigonometry
ISBN:
9781305652224
Author:
Charles P. McKeague, Mark D. Turner
Publisher:
Cengage Learning

College Algebra
Algebra
ISBN:
9781305115545
Author:
James Stewart, Lothar Redlin, Saleem Watson
Publisher:
Cengage Learning

Algebra and Trigonometry (MindTap Course List)
Algebra
ISBN:
9781305071742
Author:
James Stewart, Lothar Redlin, Saleem Watson
Publisher:
Cengage Learning