The local utility company surveys 12 randomly selected customers. For each survey participant, the company collects the following: annual electric bill (in dollars) and home size (in square feet). Output from a regression analysis appears below: Bill 13.45 +4.39*Size Coefficients Estimate Std. Error (Intercept) 13.45 Size 4.39 0.54 0.2 We are 90% confident that the mean annual electric bill increases by between 4.028 of dollars and 4.753 x dollars for every additional square foot in home size. Round your answers to three decimal places and enter in increasing order.
The local utility company surveys 12 randomly selected customers. For each survey participant, the company collects the following: annual electric bill (in dollars) and home size (in square feet). Output from a regression analysis appears below: Bill 13.45 +4.39*Size Coefficients Estimate Std. Error (Intercept) 13.45 Size 4.39 0.54 0.2 We are 90% confident that the mean annual electric bill increases by between 4.028 of dollars and 4.753 x dollars for every additional square foot in home size. Round your answers to three decimal places and enter in increasing order.

Glencoe Algebra 1, Student Edition, 9780079039897, 0079039898, 2018
18th Edition
ISBN:9780079039897
Author:Carter
Publisher:Carter
Chapter10: Statistics
Section10.3: Measures Of Spread
Problem 1GP

Related questions
Question
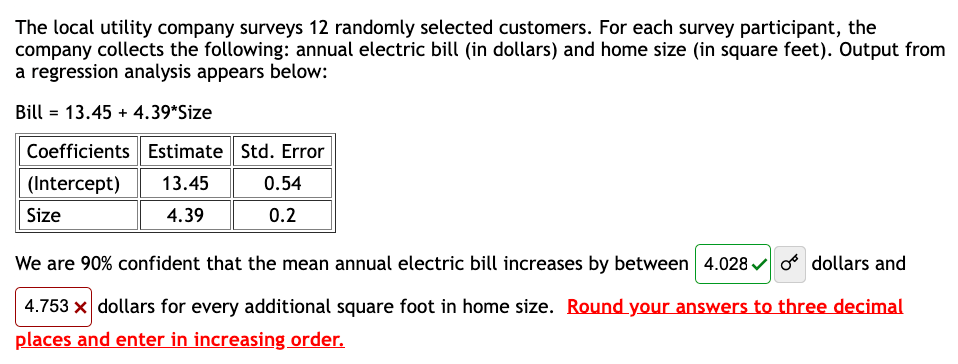
Transcribed Image Text:The local utility company surveys 12 randomly selected customers. For each survey participant, the
company collects the following: annual electric bill (in dollars) and home size (in square feet). Output from
a regression analysis appears below:
Bill 13.45 +4.39*Size
Coefficients Estimate Std. Error
(Intercept) 13.45
Size
4.39
0.54
0.2
We are 90% confident that the mean annual electric bill increases by between 4.028✔ dollars and
4.753 x dollars for every additional square foot in home size. Round your answers to three decimal
places and enter in increasing order.
Expert Solution
This question has been solved!
Explore an expertly crafted, step-by-step solution for a thorough understanding of key concepts.

Step by step
Solved in 2 steps with 1 images

Recommended textbooks for you
Glencoe Algebra 1, Student Edition, 9780079039897…
Algebra
ISBN:
9780079039897
Author:
Carter
Publisher:
McGraw Hill

Functions and Change: A Modeling Approach to Coll…
Algebra
ISBN:
9781337111348
Author:
Bruce Crauder, Benny Evans, Alan Noell
Publisher:
Cengage Learning
Glencoe Algebra 1, Student Edition, 9780079039897…
Algebra
ISBN:
9780079039897
Author:
Carter
Publisher:
McGraw Hill
Functions and Change: A Modeling Approach to Coll…
Algebra
ISBN:
9781337111348
Author:
Bruce Crauder, Benny Evans, Alan Noell
Publisher:
Cengage Learning