The manager of the company wants to know how different variables affect the sales of his vehicles. A random sample of yearly data was taken with the view to testing the model: SALES=a+BAGE+YMIL+8ENG Where SALES= amount that a vehicle is sold for($000's), AGE = age of the vehicle, MIL= the total mileage of the vehicle at the point of sale and ENG = the size of the engine. The sample of data was processed using MINITAB . The regression equation is ***** Coef StDev t-ratio p-value Predictor 1.7586 0.2525 0.3175 Constant 6.9648 0.0000 0.2124 -0.7527 AGE 0.5042 MIL 0.3586 -2.0991 ** ENG 4.8124 0.6196 7.7664 0.0000 R-sq=56.1% R-sq(adj) =59.8% Analysis of Variance Source DF MS F Regression Error 3 50 413.1291 457.7607 138.7097 2.2888 *** 0.00 Total 53
The manager of the company wants to know how different variables affect the sales of his vehicles. A random sample of yearly data was taken with the view to testing the model: SALES=a+BAGE+YMIL+8ENG Where SALES= amount that a vehicle is sold for($000's), AGE = age of the vehicle, MIL= the total mileage of the vehicle at the point of sale and ENG = the size of the engine. The sample of data was processed using MINITAB . The regression equation is ***** Coef StDev t-ratio p-value Predictor 1.7586 0.2525 0.3175 Constant 6.9648 0.0000 0.2124 -0.7527 AGE 0.5042 MIL 0.3586 -2.0991 ** ENG 4.8124 0.6196 7.7664 0.0000 R-sq=56.1% R-sq(adj) =59.8% Analysis of Variance Source DF MS F Regression Error 3 50 413.1291 457.7607 138.7097 2.2888 *** 0.00 Total 53

Glencoe Algebra 1, Student Edition, 9780079039897, 0079039898, 2018
18th Edition
ISBN:9780079039897
Author:Carter
Publisher:Carter
Chapter10: Statistics
Section10.6: Summarizing Categorical Data
Problem 26PPS

Related questions
Topic Video
Question
use appropriate statistical tables where necessary
find the value of ***.
perform the F test making sure to state null and alternative hypothesis.
Given the interpretation of the term "R-sq" and comment on its value.
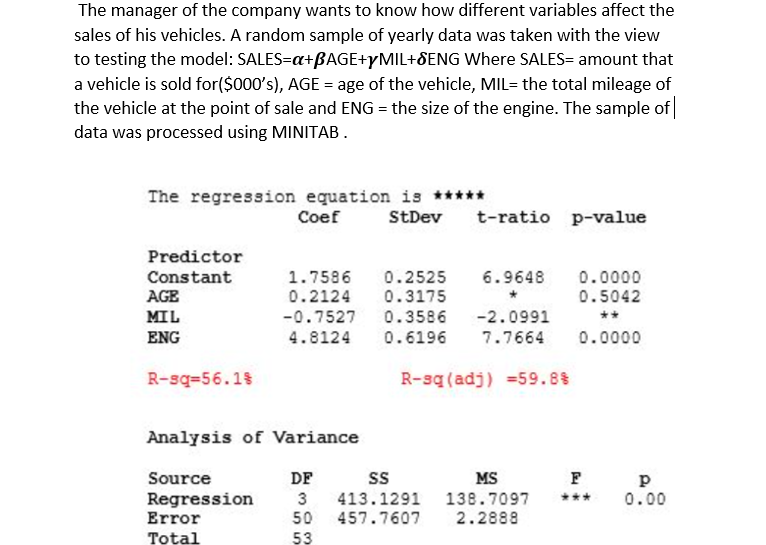
Transcribed Image Text:The manager of the company wants to know how different variables affect the
sales of his vehicles. A random sample of yearly data was taken with the view
to testing the model: SALES=a+BAGE+YMIL+8ENG Where SALES= amount that
a vehicle is sold for($000's), AGE = age of the vehicle, MIL= the total mileage of
the vehicle at the point of sale and ENG = the size of the engine. The sample of
data was processed using MINITAB.
The regression equation is *****
Coef
StDev
t-ratio p-value
Predictor
Constant
1.7586
0.2525
6.9648
0.0000
AGE
0.2124
0.3175
0.5042
MIL
-0.7527
0.3586
-2.0991
ENG
4.8124
0.6196
7.7664
0.0000
R-sq=56.1$
R-sq (adj) =59.8%
Analysis of Variance
Source
DF
MS
p
Regression
Error
3
50
413.1291
457.7607
138.7097
2.2888
0.00
***
Total
53
Expert Solution
This question has been solved!
Explore an expertly crafted, step-by-step solution for a thorough understanding of key concepts.

Step by step
Solved in 3 steps

Knowledge Booster


Learn more about
Need a deep-dive on the concept behind this application? Look no further. Learn more about this topic, statistics and related others by exploring similar questions and additional content below.Recommended textbooks for you
Glencoe Algebra 1, Student Edition, 9780079039897…
Algebra
ISBN:
9780079039897
Author:
Carter
Publisher:
McGraw Hill

Linear Algebra: A Modern Introduction
Algebra
ISBN:
9781285463247
Author:
David Poole
Publisher:
Cengage Learning

Big Ideas Math A Bridge To Success Algebra 1: Stu…
Algebra
ISBN:
9781680331141
Author:
HOUGHTON MIFFLIN HARCOURT
Publisher:
Houghton Mifflin Harcourt
Glencoe Algebra 1, Student Edition, 9780079039897…
Algebra
ISBN:
9780079039897
Author:
Carter
Publisher:
McGraw Hill
Linear Algebra: A Modern Introduction
Algebra
ISBN:
9781285463247
Author:
David Poole
Publisher:
Cengage Learning
Big Ideas Math A Bridge To Success Algebra 1: Stu…
Algebra
ISBN:
9781680331141
Author:
HOUGHTON MIFFLIN HARCOURT
Publisher:
Houghton Mifflin Harcourt

Holt Mcdougal Larson Pre-algebra: Student Edition…
Algebra
ISBN:
9780547587776
Author:
HOLT MCDOUGAL
Publisher:
HOLT MCDOUGAL