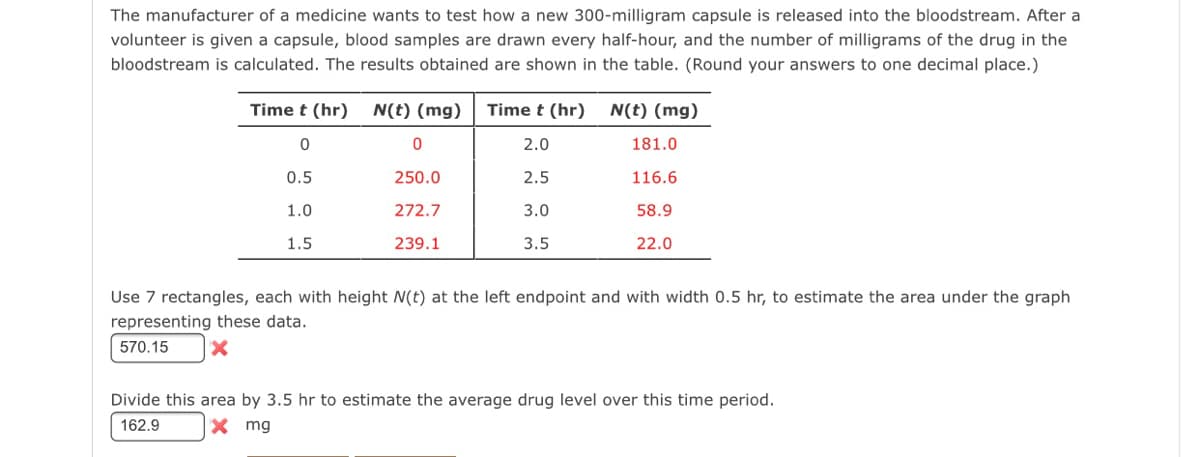
The manufacturer of a medicine wants to test how a new 300-milligram capsule is released into the bloodstream. After a volunteer is given a capsule, blood samples are drawn every half-hour, and the number of milligrams of the drug in the bloodstream is calculated. The results obtained are shown in the table. (Round your answers to one decimal place.) Time t (hr) N(t) (mg) Time t (hr) N(t) (mg) 2.0 181.0 0.5 250.0 2.5 116.6 1.0 272.7 3.0 58.9 1.5 239.1 3.5 22.0 Use 7 rectangles, each with height N(t) at the left endpoint and with width 0.5 hr, to estimate the area under the graph representing these data. 570.15 Divide this area by 3.5 hr to estimate the average drug level over this time period. 162.9 X mg
The manufacturer of a medicine wants to test how a new 300-milligram capsule is released into the bloodstream. After a volunteer is given a capsule, blood samples are drawn every half-hour, and the number of milligrams of the drug in the bloodstream is calculated. The results obtained are shown in the table. (Round your answers to one decimal place.) Time t (hr) N(t) (mg) Time t (hr) N(t) (mg) 2.0 181.0 0.5 250.0 2.5 116.6 1.0 272.7 3.0 58.9 1.5 239.1 3.5 22.0 Use 7 rectangles, each with height N(t) at the left endpoint and with width 0.5 hr, to estimate the area under the graph representing these data. 570.15 Divide this area by 3.5 hr to estimate the average drug level over this time period. 162.9 X mg

Mathematics For Machine Technology
8th Edition
ISBN:9781337798310
Author:Peterson, John.
Publisher:Peterson, John.
Chapter24: Percent Practical Applications
Section: Chapter Questions
Problem 33A: The average percent defective product of a manufacturing plant is 1.20%. On a particular day 50...

Related questions
Question

Transcribed Image Text:The manufacturer of a medicine wants to test how a new 300-milligram capsule is released into the bloodstream. After a
volunteer is given a capsule, blood samples are drawn every half-hour, and the number of milligrams of the drug in the
bloodstream is calculated. The results obtained are shown in the table. (Round your answers to one decimal place.)
Time t (hr)
N(t) (mg)
Time t (hr)
N(t) (mg)
2.0
181.0
0.5
250.0
2.5
116.6
1.0
272.7
3.0
58.9
1.5
239.1
3.5
22.0
Use 7 rectangles, each with height N(t) at the left endpoint and with width 0.5 hr, to estimate the area under the graph
representing these data.
570.15
Divide this area by 3.5 hr to estimate the average drug level over this time period.
162.9
X mg
Expert Solution
This question has been solved!
Explore an expertly crafted, step-by-step solution for a thorough understanding of key concepts.

This is a popular solution!

Trending now
This is a popular solution!

Step by step
Solved in 2 steps with 1 images

Knowledge Booster


Learn more about
Need a deep-dive on the concept behind this application? Look no further. Learn more about this topic, calculus and related others by exploring similar questions and additional content below.Recommended textbooks for you
Mathematics For Machine Technology
Advanced Math
ISBN:
9781337798310
Author:
Peterson, John.
Publisher:
Cengage Learning,

Algebra & Trigonometry with Analytic Geometry
Algebra
ISBN:
9781133382119
Author:
Swokowski
Publisher:
Cengage

Algebra for College Students
Algebra
ISBN:
9781285195780
Author:
Jerome E. Kaufmann, Karen L. Schwitters
Publisher:
Cengage Learning
Mathematics For Machine Technology
Advanced Math
ISBN:
9781337798310
Author:
Peterson, John.
Publisher:
Cengage Learning,
Algebra & Trigonometry with Analytic Geometry
Algebra
ISBN:
9781133382119
Author:
Swokowski
Publisher:
Cengage
Algebra for College Students
Algebra
ISBN:
9781285195780
Author:
Jerome E. Kaufmann, Karen L. Schwitters
Publisher:
Cengage Learning

Intermediate Algebra
Algebra
ISBN:
9781285195728
Author:
Jerome E. Kaufmann, Karen L. Schwitters
Publisher:
Cengage Learning


Algebra: Structure And Method, Book 1
Algebra
ISBN:
9780395977224
Author:
Richard G. Brown, Mary P. Dolciani, Robert H. Sorgenfrey, William L. Cole
Publisher:
McDougal Littell