The manufacturer of Beanie Baby dolls used quarterly price data for 2005 - 2013 IV (t= 1,..., 36) and the regression equation Pt= a + bt+ c 1 D1t+ c2 D2t+ c3 D3 t to forecast doll prices in the year 2014. Pt is the quarterly price of dolls, and D1, D2 t, and D3 fare dummy variables for quarters I, II, and III, respectively. DEPENDENT VARIABLE: PT OBSERVATIONS: 36 R-SQUARE 0.9078 P-VALUE ON F 0.0001 PARAMETER ESTIMATE F-RATIO 76.34 STANDARD ERROR 6.20 VARIABLE T-RATIO 3.87 INTERCEPT 24.0 T 0.800 0.240 3.33 D1 -8.0 2.60 -3.08 D2 -6.00 1.80 -3.33 D3 -4.0 0.60 -6.67 What is the estimated intercept of the trend line in the 1st quarter? 4 O 32 24 O-8 O 16 Acti Go to Onone of the above P-VALUE 0.0005 0.0022 0.0043 0.0022 0.0001
The manufacturer of Beanie Baby dolls used quarterly price data for 2005 - 2013 IV (t= 1,..., 36) and the regression equation Pt= a + bt+ c 1 D1t+ c2 D2t+ c3 D3 t to forecast doll prices in the year 2014. Pt is the quarterly price of dolls, and D1, D2 t, and D3 fare dummy variables for quarters I, II, and III, respectively. DEPENDENT VARIABLE: PT OBSERVATIONS: 36 R-SQUARE 0.9078 P-VALUE ON F 0.0001 PARAMETER ESTIMATE F-RATIO 76.34 STANDARD ERROR 6.20 VARIABLE T-RATIO 3.87 INTERCEPT 24.0 T 0.800 0.240 3.33 D1 -8.0 2.60 -3.08 D2 -6.00 1.80 -3.33 D3 -4.0 0.60 -6.67 What is the estimated intercept of the trend line in the 1st quarter? 4 O 32 24 O-8 O 16 Acti Go to Onone of the above P-VALUE 0.0005 0.0022 0.0043 0.0022 0.0001

Functions and Change: A Modeling Approach to College Algebra (MindTap Course List)
6th Edition
ISBN:9781337111348
Author:Bruce Crauder, Benny Evans, Alan Noell
Publisher:Bruce Crauder, Benny Evans, Alan Noell
Chapter5: A Survey Of Other Common Functions
Section5.6: Higher-degree Polynomials And Rational Functions
Problem 1TU: The following fictitious table shows kryptonite price, in dollar per gram, t years after 2006. t=...

Related questions
Question
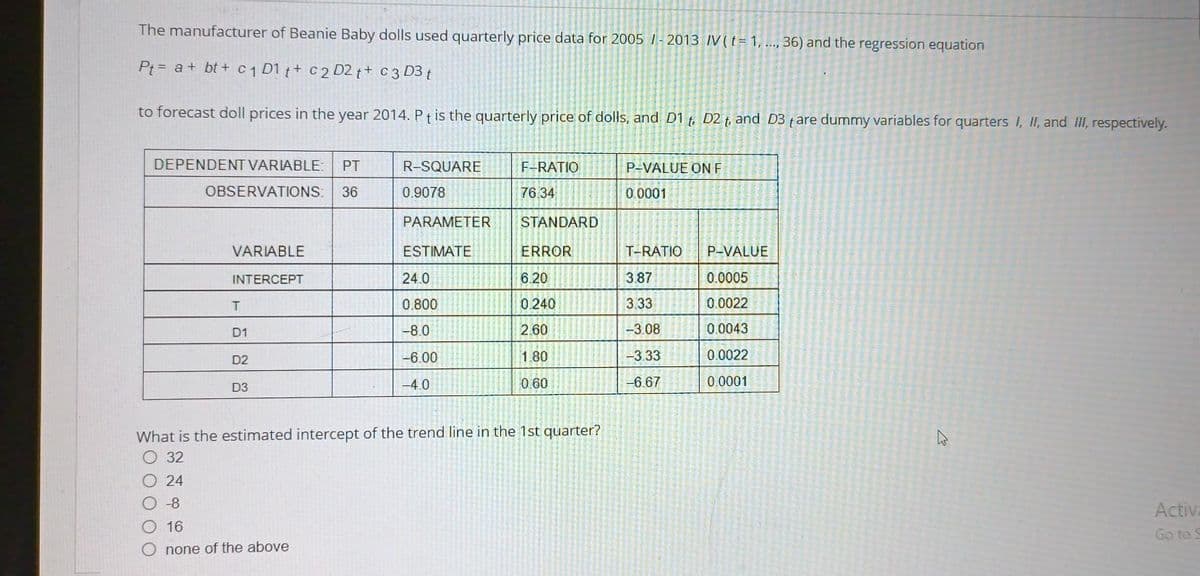
Transcribed Image Text:The manufacturer of Beanie Baby dolls used quarterly price data for 2005 - 2013 IV (t= 1, ..., 36) and the regression equation
Pt = a + bt+ c ₁ D1 t + c ₂ D2t+ c3 D3 t
to forecast doll prices in the year 2014. Pt is the quarterly price of dolls, and D1 t, D2 t, and D3 tare dummy variables for quarters I, II, and III, respectively.
DEPENDENT VARIABLE: PT
R-SQUARE
0.9078
P-VALUE ON F
0.0001
OBSERVATIONS:
36
PARAMETER
ESTIMATE
F-RATIO
76.34
STANDARD
ERROR
6.20
VARIABLE
T-RATIO
INTERCEPT
24.0
3.87
T
0.800
0.240
3.33
D1
-8.0
2.60
-3.08
-6.00
D2
1.80
-3.33
-4.0
0.60
-6.67
D3
What is the estimated intercept of the trend line in the 1st quarter?
32
O 24
O-8
16
Activa
Go to S
O none of the above
P-VALUE
0.0005
0.0022
0.0043
0.0022
0.0001
Expert Solution
This question has been solved!
Explore an expertly crafted, step-by-step solution for a thorough understanding of key concepts.

This is a popular solution!

Trending now
This is a popular solution!

Step by step
Solved in 4 steps with 4 images

Recommended textbooks for you
Functions and Change: A Modeling Approach to Coll…
Algebra
ISBN:
9781337111348
Author:
Bruce Crauder, Benny Evans, Alan Noell
Publisher:
Cengage Learning
Functions and Change: A Modeling Approach to Coll…
Algebra
ISBN:
9781337111348
Author:
Bruce Crauder, Benny Evans, Alan Noell
Publisher:
Cengage Learning