The margin of error is

Big Ideas Math A Bridge To Success Algebra 1: Student Edition 2015
1st Edition
ISBN:9781680331141
Author:HOUGHTON MIFFLIN HARCOURT
Publisher:HOUGHTON MIFFLIN HARCOURT
Chapter11: Data Analysis And Displays
Section: Chapter Questions
Problem 6CR

Related questions
Question
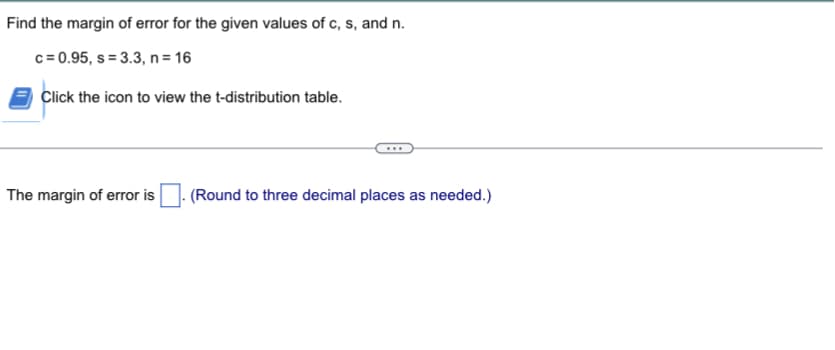
Transcribed Image Text:Find the margin of error for the given values of c, s, and n.
c=0.95, s= 3.3, n = 16
Click the icon to view the t-distribution table.
The margin of error is
(Round to three decimal places as needed.)
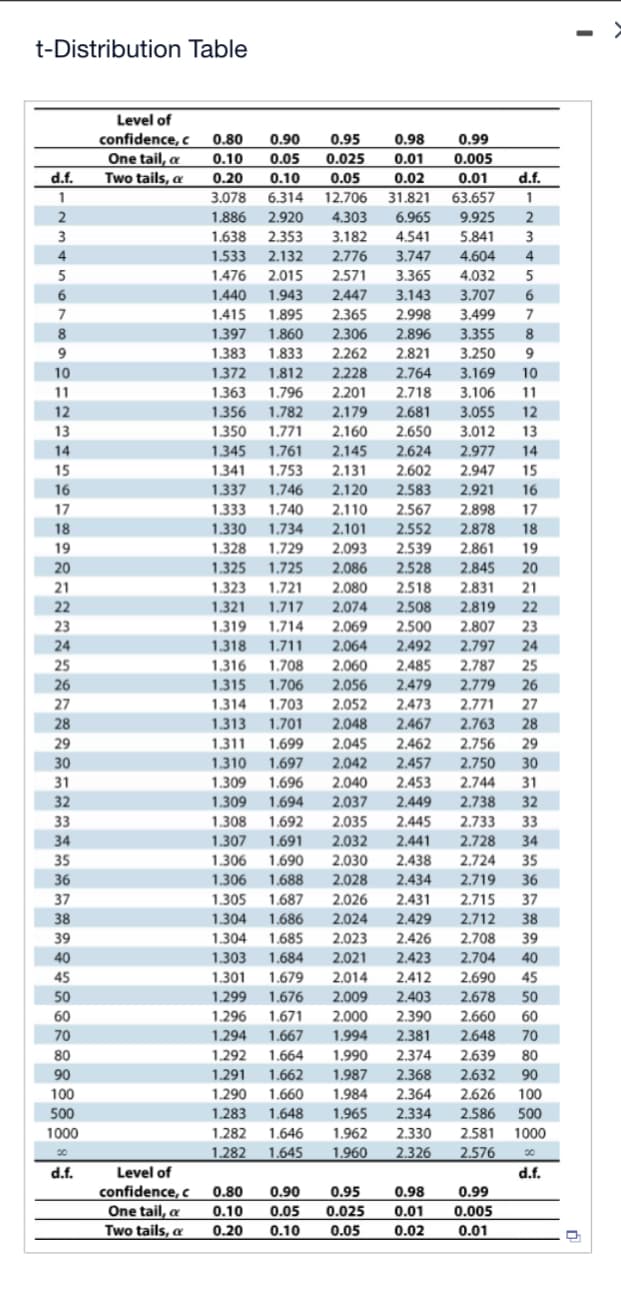
Transcribed Image Text:t-Distribution Table
d.f.
1
2
3
4
5
6
7
8
9
10
11
12
13
14
15
16
17
18
19
20
21
22
23
24
25
26
27
28
29
30
31
32
33
34
35
36
37
38
39
40
45
50
60
70
80
90
100
500
1000
30
d.f.
Level of
confidence, c 0.80 0.90 0.95
0.98
0.99
0.10 0.05
0.025
0.01
0.005
0.20 0.10
0.05
0.02
0.01 d.f.
3.078 6.314
12.706
31.821
63.657
1
1.886 2.920 4.303
6.965
9.925
2
4.541
5.841 3
3.747
4.604 4
3.365 4.032 5
3.707 6
3.143
1.638 2.353 3.182
1.533 2.132 2.776
1.476 2.015 2.571
1.440 1.943 2.447
1.415 1.895 2.365
1.397 1.860 2.306
1.383 1.833 2.262
1.372 1.812 2.228
1.363 1.796
2.998
3.499 7
2.896
3.355
8
2.821
3.250 9
2.764
3.169
2.201 2.718
3.106
1.356 1.782
2.179
2.681 3.055 12
1.350 1.771
2.160 2.650
3.012
13
1.345 1.761 2.145
2.624
2.947
1.341 1.753
1.337 1.746 2.120
1.333 1.740 2.110
1.330
17
18
2.977 14
2.131 2.602
15
2.583 2.921 16
2.567 2.898
1.734 2.101 2.552 2.878
2.093
2.539 2.861
1.325 1.725 2.086 2.528 2.845
1.323 1.721 2.080 2.518 2.831 21
2.819
2.807 23
1.328 1.729
19
20
1.321 1.717
22
2.074 2.508
2.069 2.500
1.318 1.711 2.064
1.319 1.714
2.492
2.797 24
2.485
2.787 25
2.779
1.316 1.708 2.060
1.315 1.706 2.056
1.314 1.703 2.052
2.048 2.467
2.479
26
2.473 2.771 27
1.313 1.701
1.311 1.699
2.045 2.462
2.763 28
2.756 29
2.750 30
2.744 31
1.310 1.697 2.042 2.457
1.309 1.696 2.040 2.453
1.309 1.694 2.037 2.449
1.308 1.692 2.035 2.445
2.738 32
2.733 33
1.307 1.691
2.032 2.441
2.728 34
1.306 1.690
2.030
2.438
2.724
35
1.306 1.688
2.028
2.434
2.719
36
1.305
1.687
2.026 2.431
2.715
37
1.304 1.686
2.024
2.429
2.712 38
2.426 2.708 39
2.423 2.704 40
2.412 2.690 45
2.678
50
2.660
1.304 1.685 2.023
1.303 1.684 2.021
1.301 1.679 2.014
1.299 1.676 2.009 2.403
1.296 1.671 2.000 2.390
1.294 1.667 1.994 2.381
1.990 2.374
1.987 2.368 2.632
1.984 2.364 2.626 100
1.965 2.334 2.586 500
2.581 1000
2.648
2.639
80
90
1.282 1.646 1.962 2.330
1.282 1.645
1.960 2.326
2.576
One tail, a
Two tails, a
Level of
confidence, c
One tail, a
Two tails, a
1.292 1.664
1.291 1.662
1.290 1.660
1.283 1.648
0.80 0.90 0.95
0.98
0.10 0.05
0.025
0.01
0.20
0.10
0.05 0.02
0.99
0.005
0.01
10
11
60
70
30
d.f.
D
Expert Solution
This question has been solved!
Explore an expertly crafted, step-by-step solution for a thorough understanding of key concepts.

Step by step
Solved in 3 steps with 1 images

Recommended textbooks for you
Big Ideas Math A Bridge To Success Algebra 1: Stu…
Algebra
ISBN:
9781680331141
Author:
HOUGHTON MIFFLIN HARCOURT
Publisher:
Houghton Mifflin Harcourt

Glencoe Algebra 1, Student Edition, 9780079039897…
Algebra
ISBN:
9780079039897
Author:
Carter
Publisher:
McGraw Hill
Big Ideas Math A Bridge To Success Algebra 1: Stu…
Algebra
ISBN:
9781680331141
Author:
HOUGHTON MIFFLIN HARCOURT
Publisher:
Houghton Mifflin Harcourt
Glencoe Algebra 1, Student Edition, 9780079039897…
Algebra
ISBN:
9780079039897
Author:
Carter
Publisher:
McGraw Hill