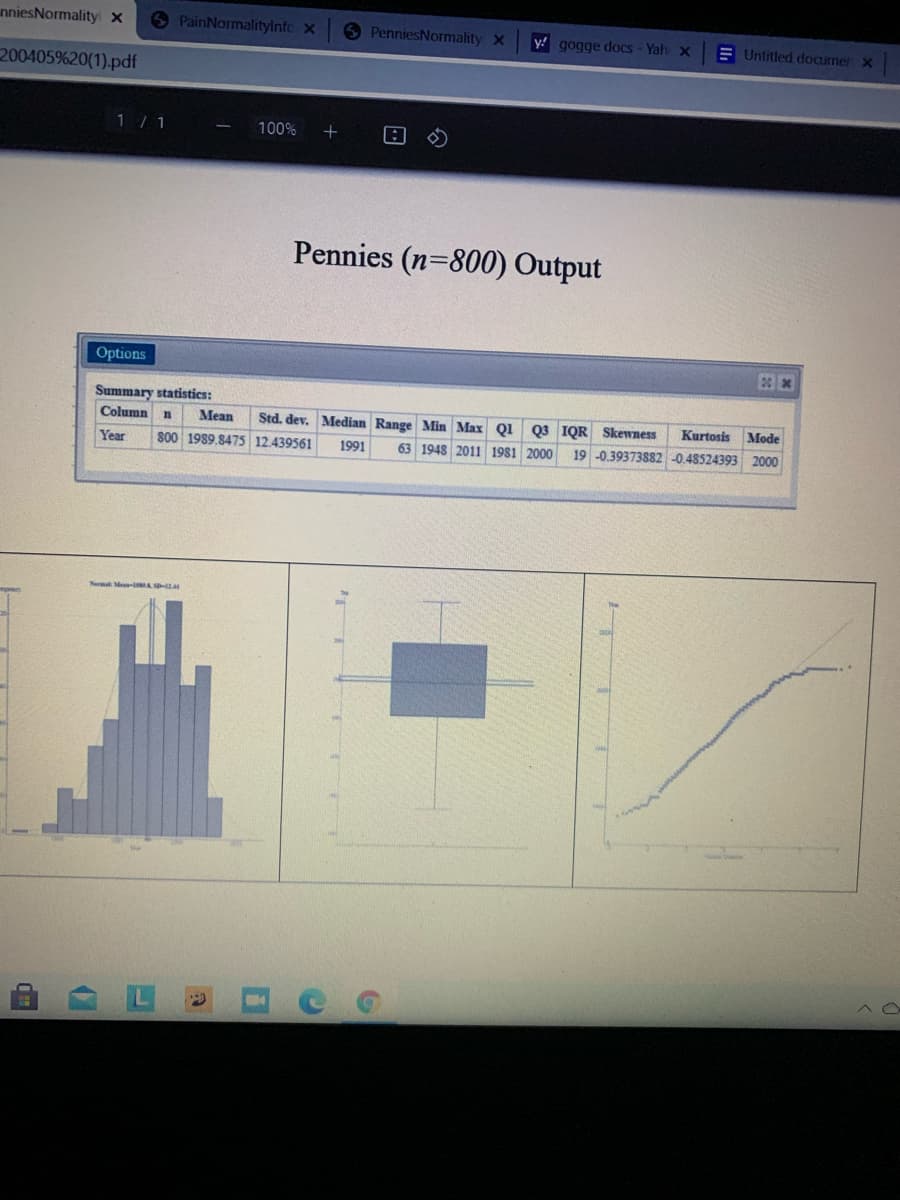
The mean is only slightly less than the distribution is left skewed. which suggests the is within the acceptable range (between -1 and This +1). The is also between the acceptable range of -3 and +3.

Glencoe Algebra 1, Student Edition, 9780079039897, 0079039898, 2018
18th Edition
ISBN:9780079039897
Author:Carter
Publisher:Carter
Chapter4: Equations Of Linear Functions
Section4.6: Regression And Median-fit Lines
Problem 2GP
icon
Related questions
icon
Concept explainers
Topic Video
Question
ke/launch.jsp?course assessment id%3_1726756_1&course_id%3_1979437_1&content id%3 53690138 18step=null
v Question Completion Status:
QUESTION 1
The U.S. Mint produces approximately 13 billion pennies a year. A random sample (n=800) of pennies were collected and their minted years were recorded. The output,
histogram, box-plot, and QQ plot for the distribution of the years of production for the pennies can be found on the attached document.
PenniesNormalitylnformation 200405.pdf
The mean is only slightly less than the
distribution is left skewed.
which suggests the
1. histogram
is within the acceptable range (between -1 and
This
+1).
Interquartile range
2.
The
is also between the acceptable range of -3 and +3.
3. kurtosis
4. longer
The
has only one mode and the tails are approximately equal
length.
5. median
The box and whisker plot shows the median is approximately in the center of 6. Normal
the
7. QQ Plot
v The left whisker is slightly
than the right whisker.
8. shorter
v The raw scores hug the theoretical line on the
9. skewnéss
Therefore, there is enough evidence to assume that the data can be considered
10. Skewed
QUESTION 2
r doses from oninids have cantured the national cnotlight Riahtly so- they kill nearly 30.000 Amaricas a vear and cauce more than 1 million hosnitalizations Howove
ave and Submit to save and submit. Click Save All Answers to save all answers.
Transcribed Image Text:ke/launch.jsp?course assessment id%3_1726756_1&course_id%3_1979437_1&content id%3 53690138 18step=null v Question Completion Status: QUESTION 1 The U.S. Mint produces approximately 13 billion pennies a year. A random sample (n=800) of pennies were collected and their minted years were recorded. The output, histogram, box-plot, and QQ plot for the distribution of the years of production for the pennies can be found on the attached document. PenniesNormalitylnformation 200405.pdf The mean is only slightly less than the distribution is left skewed. which suggests the 1. histogram is within the acceptable range (between -1 and This +1). Interquartile range 2. The is also between the acceptable range of -3 and +3. 3. kurtosis 4. longer The has only one mode and the tails are approximately equal length. 5. median The box and whisker plot shows the median is approximately in the center of 6. Normal the 7. QQ Plot v The left whisker is slightly than the right whisker. 8. shorter v The raw scores hug the theoretical line on the 9. skewnéss Therefore, there is enough evidence to assume that the data can be considered 10. Skewed QUESTION 2 r doses from oninids have cantured the national cnotlight Riahtly so- they kill nearly 30.000 Amaricas a vear and cauce more than 1 million hosnitalizations Howove ave and Submit to save and submit. Click Save All Answers to save all answers.
unniesNormality x
6 PainNormalitylnfc x
O PenniesNormality X
y gogge docs - Yah x
E Untitled documer x
200405%20(1).pdf
100%
Pennies (n=800) Output
Options
Summary statistics:
Column n
Mean
Std. dev. Median Range Min Max Q1
Q3 IQR Skewness
Kurtosis
Mode
Year
800 1989.8475 12.439561
1991
63 1948 2011 1981 2000
19 -0.39373882 -0.48524393 2000
Nermal Me- M
Transcribed Image Text:unniesNormality x 6 PainNormalitylnfc x O PenniesNormality X y gogge docs - Yah x E Untitled documer x 200405%20(1).pdf 100% Pennies (n=800) Output Options Summary statistics: Column n Mean Std. dev. Median Range Min Max Q1 Q3 IQR Skewness Kurtosis Mode Year 800 1989.8475 12.439561 1991 63 1948 2011 1981 2000 19 -0.39373882 -0.48524393 2000 Nermal Me- M
Expert Solution
trending now

Trending now

This is a popular solution!

steps

Step by step

Solved in 2 steps

Blurred answer
Knowledge Booster
Centre, Spread, and Shape of a Distribution
Learn more about
Need a deep-dive on the concept behind this application? Look no further. Learn more about this topic, statistics and related others by exploring similar questions and additional content below.
Recommended textbooks for you
Glencoe Algebra 1, Student Edition, 9780079039897…
Algebra
ISBN:
9780079039897
Author:
Carter
Publisher:
McGraw Hill
College Algebra
College Algebra
Algebra
ISBN:
9781337282291
Author:
Ron Larson
Publisher:
Cengage Learning
Trigonometry (MindTap Course List)
Trigonometry
ISBN:
9781337278461
Author:
Ron Larson
Publisher:
Cengage Learning
Algebra & Trigonometry with Analytic Geometry
Algebra
ISBN:
9781133382119
Author:
Swokowski
Publisher:
Cengage
Big Ideas Math A Bridge To Success Algebra 1: Stu…
Algebra
ISBN:
9781680331141
Author:
HOUGHTON MIFFLIN HARCOURT
Publisher:
Houghton Mifflin Harcourt
Linear Algebra: A Modern Introduction
Algebra
ISBN:
9781285463247
Author:
David Poole
Publisher:
Cengage Learning