The mean number of English courses taken in a two-year time period by male and female college students is believed to be about the same. An experiment is conducted and data are collected from 29 males and 16 females. The males took an English courses with a standard deviation of 0.9. The females took an average of five English courses with a standard deviation of 1.1. Are the means statistically the same? (Use a = 0.05) NOTE: If you are using a Student's t-distribution for the problem, including for paired data, you may assume that the underlying population is normally distributed. (In general, you must first prove that assumption, though.) O Part (a) O Part (b) O Part (c) O Part (d) O Part (e) O Part () O Part (g) O Part (h) Indicate the correct decision ("reject" or "do not reject" the null hypothesis), the reason for it, and write an appropriate conclusion. () Alpha (Enter an exact number as an integer, fraction, decimal.) a= () Decision: O reject the null hypothesis O do not reject the null hypothesis
The mean number of English courses taken in a two-year time period by male and female college students is believed to be about the same. An experiment is conducted and data are collected from 29 males and 16 females. The males took an English courses with a standard deviation of 0.9. The females took an average of five English courses with a standard deviation of 1.1. Are the means statistically the same? (Use a = 0.05) NOTE: If you are using a Student's t-distribution for the problem, including for paired data, you may assume that the underlying population is normally distributed. (In general, you must first prove that assumption, though.) O Part (a) O Part (b) O Part (c) O Part (d) O Part (e) O Part () O Part (g) O Part (h) Indicate the correct decision ("reject" or "do not reject" the null hypothesis), the reason for it, and write an appropriate conclusion. () Alpha (Enter an exact number as an integer, fraction, decimal.) a= () Decision: O reject the null hypothesis O do not reject the null hypothesis

Glencoe Algebra 1, Student Edition, 9780079039897, 0079039898, 2018
18th Edition
ISBN:9780079039897
Author:Carter
Publisher:Carter
Chapter10: Statistics
Section10.4: Distributions Of Data
Problem 19PFA

Related questions
Topic Video
Question
I really need help with this, please show your work when you explain, thanks
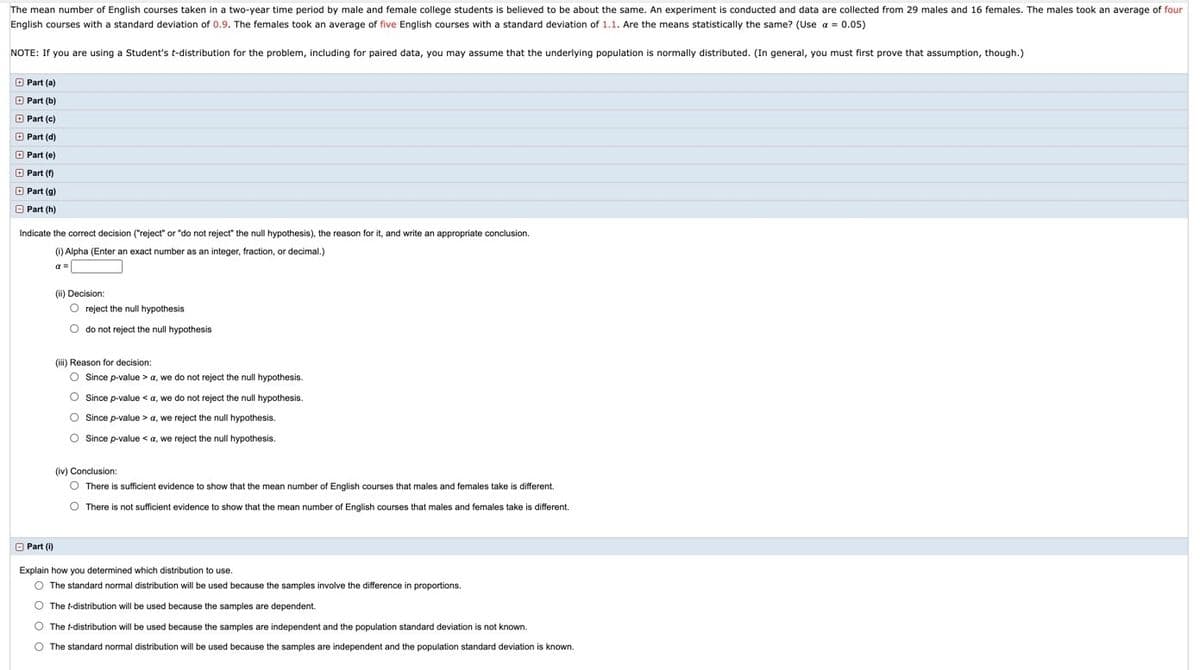
Transcribed Image Text:The mean number of English courses taken in a two-year time period by male and female college students is believed to be about the same. An experiment is conducted and data are collected from 29 males and 16 females. The males took an average of four
English courses with a standard deviation of 0.9. The females took an average of five English courses with a standard deviation of 1.1. Are the means statistically the same? (Use a = 0.05)
NOTE: If you are using a Student's t-distribution for the problem, including for paired data, you may assume that the underlying population is normally distributed. (In general, you must first prove that assumption, though.)
O Part (a)
O Part (b)
O Part (c)
O Part (d)
O Part (e)
O Part (f)
O Part (g)
O Part (h)
Indicate the correct decision ("reject" or "do not reject" the null hypothesis), the reason for it, and write an appropriate conclusion.
(i) Alpha (Enter an exact number as an integer, fraction, or decimal.)
a =
(ii) Decision:
O reject the null hypothesis
O do not reject the null hypothesis
(iii) Reason for decision:
O Since p-value > a, we do not reject the null hypothesis.
O Since p-value < a, we do not reject the null
O Since p-value > a, we reject the null hypothesis.
O Since p-value < a, we reject the null hypothesis.
(iv) Conclusion:
O There is sufficient evidence
show that the mean number of English courses that males and females take is different.
O There is not sufficient evidence to show that the mean number of English courses that males and females take is different.
O Part (i)
Explain how you determined which distribution to use.
O The standard normal distribution will be used because the samples involve the difference in proportions.
O The t-distribution will be used because the samples are dependent.
O The t-distribution will be used because the samples are independent and the population standard deviation is not known.
O The standard normal distribution will be used because the samples are independent and the population standard deviation is known.
Expert Solution
This question has been solved!
Explore an expertly crafted, step-by-step solution for a thorough understanding of key concepts.

This is a popular solution!

Trending now
This is a popular solution!

Step by step
Solved in 3 steps

Knowledge Booster


Learn more about
Need a deep-dive on the concept behind this application? Look no further. Learn more about this topic, statistics and related others by exploring similar questions and additional content below.Recommended textbooks for you
Glencoe Algebra 1, Student Edition, 9780079039897…
Algebra
ISBN:
9780079039897
Author:
Carter
Publisher:
McGraw Hill
Glencoe Algebra 1, Student Edition, 9780079039897…
Algebra
ISBN:
9780079039897
Author:
Carter
Publisher:
McGraw Hill