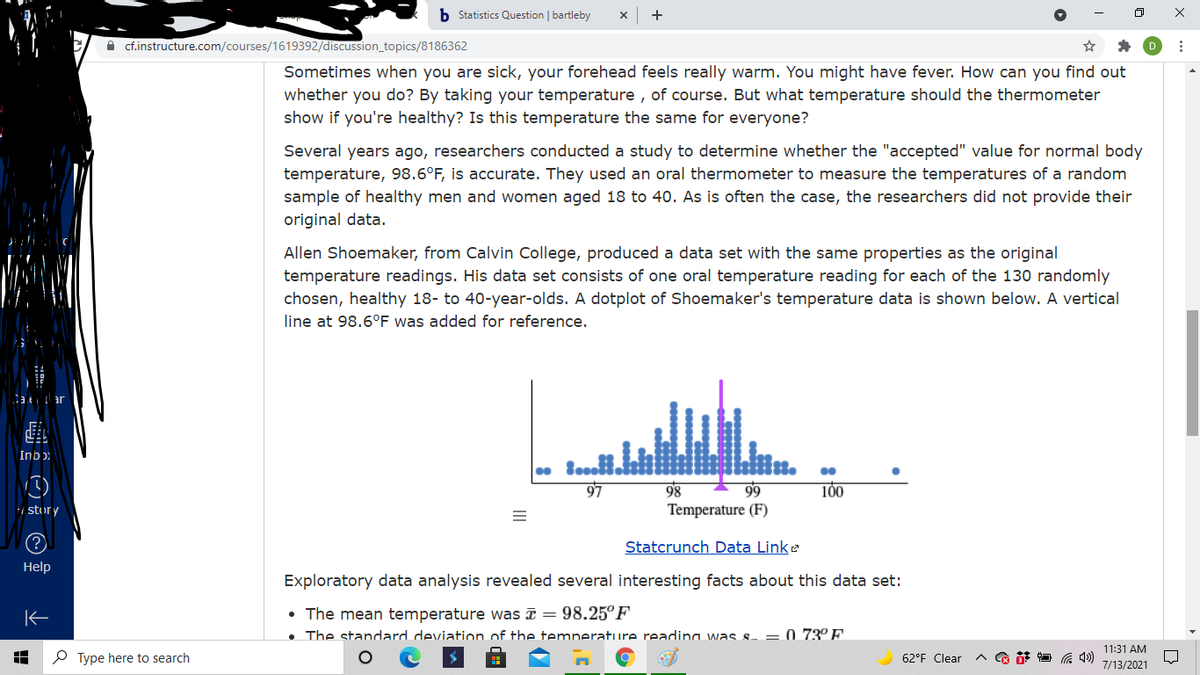
• The mean temperature was = 98.25°F • The standard deviation of the temperature reading was s, = 0.73°F Is "normal" body temperature really 98.6°F? Use a = 0.05 to test the claim that the average body temperature for healthy 18- to 40-year-olds is actually less than 98.6°F. 1. What type of significance test would you run given the data above? 2. What conditions must be satisfied for the test you have chosen in order to get valid results? Are the conditions satisfied? 3. Run your test for significance using the data link above. Attach the data output including the hypotheses that you have chosen.

Holt Mcdougal Larson Pre-algebra: Student Edition 2012
1st Edition
ISBN:9780547587776
Author:HOLT MCDOUGAL
Publisher:HOLT MCDOUGAL
Chapter11: Data Analysis And Probability
Section11.4: Collecting Data
Problem 16E
icon
Related questions
icon
Concept explainers
Topic Video
Question
b Statistics Question | bartleby
courses/1619392/discussion_topics/8186362
• The mean temperature was = 98.25°F
• The standard deviation of the temperature reading was sz = 0.73°F
Is "normal" body temperature really 98.6°F? Use a = 0.05 to test the claim that the average body
temperature for healthy 18- to 40-year-olds is actually less than 98.6°F.
1. What type of significance test would you run given the data above?
2. What conditions must be satisfied for the test you have chosen in order to get valid results?
Are the conditions satisfied?
3. Run your test for significance using the data link above. Attach the data output including the
burs
hypotheses that you have chosen.
4. Using the p-value (or critical values & test statistic), draw a proper conclusion and write said
iro ps
conclusion in context.
5. Based on your conclusion, which type of error could have been made: a Type I error or a Type
Caler 'ar
II error. Justify your answer.
6. If you were a researcher, what type of data would you be interested in collecting? What would
Inbo
your null and alternative hypotheses be?
· For example: Just down from my house is a stop sign, in which most people roll
through without fully stopping. My claim would be "most people fail to stop at the
stop sign" with Ho: p = 0.50 and H1: p > 0.50. I would watch at random times of
the day and keep a tally of those who do make a full stop vs. those who roll
through or fail to stop at all. My proportion would be the number of people who
don't stop divided by the total observations I recorded
Histor
(?
Help
11:35 AM
P Type here to search
62°F Clear
7/13/2021
Transcribed Image Text:b Statistics Question | bartleby courses/1619392/discussion_topics/8186362 • The mean temperature was = 98.25°F • The standard deviation of the temperature reading was sz = 0.73°F Is "normal" body temperature really 98.6°F? Use a = 0.05 to test the claim that the average body temperature for healthy 18- to 40-year-olds is actually less than 98.6°F. 1. What type of significance test would you run given the data above? 2. What conditions must be satisfied for the test you have chosen in order to get valid results? Are the conditions satisfied? 3. Run your test for significance using the data link above. Attach the data output including the burs hypotheses that you have chosen. 4. Using the p-value (or critical values & test statistic), draw a proper conclusion and write said iro ps conclusion in context. 5. Based on your conclusion, which type of error could have been made: a Type I error or a Type Caler 'ar II error. Justify your answer. 6. If you were a researcher, what type of data would you be interested in collecting? What would Inbo your null and alternative hypotheses be? · For example: Just down from my house is a stop sign, in which most people roll through without fully stopping. My claim would be "most people fail to stop at the stop sign" with Ho: p = 0.50 and H1: p > 0.50. I would watch at random times of the day and keep a tally of those who do make a full stop vs. those who roll through or fail to stop at all. My proportion would be the number of people who don't stop divided by the total observations I recorded Histor (? Help 11:35 AM P Type here to search 62°F Clear 7/13/2021
b Statistics Question | bartleby
A cf.instructure.com/courses/1619392/discussion_topics/8186362
Sometimes when you are sick, your forehead feels really warm. You might have fever. How can you find out
whether you do? By taking your temperature , of course. But what temperature should the thermometer
show if you're healthy? Is this temperature the same for everyone?
Several years ago, researchers conducted a study to determine whether the "accepted" value for normal body
temperature, 98.6°F, is accurate. They used an oral thermometer to measure the temperatures of a random
sample of healthy men and women aged 18 to 40. As is often the case, the researchers did not provide their
original data.
Allen Shoemaker, from Calvin College, produced a data set with the same properties as the original
temperature readings. His data set consists of one oral temperature reading for each of the 130 randomly
chosen, healthy 18- to 40-year-olds. A dotplot of Shoemaker's temperature data is shown below. A vertical
line at 98.6°F was added for reference.
Inb)
97
98
99
Temperature (F)
100
story
Statcrunch Data Link
Help
Exploratory data analysis revealed several interesting facts about this data set:
The mean temperature was ī = 98.25°F
• The standard deviation of the temnerature readina was s- = 0.73º F.
11:31 AM
P Type here to search
62°F Clear
7/13/2021
Transcribed Image Text:b Statistics Question | bartleby A cf.instructure.com/courses/1619392/discussion_topics/8186362 Sometimes when you are sick, your forehead feels really warm. You might have fever. How can you find out whether you do? By taking your temperature , of course. But what temperature should the thermometer show if you're healthy? Is this temperature the same for everyone? Several years ago, researchers conducted a study to determine whether the "accepted" value for normal body temperature, 98.6°F, is accurate. They used an oral thermometer to measure the temperatures of a random sample of healthy men and women aged 18 to 40. As is often the case, the researchers did not provide their original data. Allen Shoemaker, from Calvin College, produced a data set with the same properties as the original temperature readings. His data set consists of one oral temperature reading for each of the 130 randomly chosen, healthy 18- to 40-year-olds. A dotplot of Shoemaker's temperature data is shown below. A vertical line at 98.6°F was added for reference. Inb) 97 98 99 Temperature (F) 100 story Statcrunch Data Link Help Exploratory data analysis revealed several interesting facts about this data set: The mean temperature was ī = 98.25°F • The standard deviation of the temnerature readina was s- = 0.73º F. 11:31 AM P Type here to search 62°F Clear 7/13/2021
Expert Solution
trending now

Trending now

This is a popular solution!

steps

Step by step

Solved in 4 steps with 2 images

Blurred answer
Knowledge Booster
Centre, Spread, and Shape of a Distribution
Learn more about
Need a deep-dive on the concept behind this application? Look no further. Learn more about this topic, statistics and related others by exploring similar questions and additional content below.
Recommended textbooks for you
Holt Mcdougal Larson Pre-algebra: Student Edition…
Algebra
ISBN:
9780547587776
Author:
HOLT MCDOUGAL
Publisher:
HOLT MCDOUGAL
Functions and Change: A Modeling Approach to Coll…
Algebra
ISBN:
9781337111348
Author:
Bruce Crauder, Benny Evans, Alan Noell
Publisher:
Cengage Learning
Linear Algebra: A Modern Introduction
Algebra
ISBN:
9781285463247
Author:
David Poole
Publisher:
Cengage Learning
Glencoe Algebra 1, Student Edition, 9780079039897…
Algebra
ISBN:
9780079039897
Author:
Carter
Publisher:
McGraw Hill