The median selling price of small houses in Paarl from 2000 to 2004 are shown in the table below. Let Y denote the median sales price and x the year (replace the year values with integers 1 to 5). YEAR Median Sales Price (XR10 000) 2000 27.6 2001 32.5 2002 35.9 2003 39.3 2004 44.2 Year Y XY x? y? 2000 1 27.6 27.6 761.8 1 056.3 1 288.8 2001 32.5 65.0 2002 3 35.9 107.7 9 2003 4 39.3 157.2 16 1544.5 2004 44.2 221.0 25 1953.6 15 179.5 578.5 55 6 605.0 3.1 Fit the model Y = Bo + B1x + ɛ 3.2 What would you conclude from the results in 3.1? 3.3 Construct a 95% prediction interval for the median sale price in 2005. Interpret your answer 3.4 Calculate the correlation coefficient and interpret the value 3.5 Calculate the coefficient of determination and interpret the value 14 2.
The median selling price of small houses in Paarl from 2000 to 2004 are shown in the table below. Let Y denote the median sales price and x the year (replace the year values with integers 1 to 5). YEAR Median Sales Price (XR10 000) 2000 27.6 2001 32.5 2002 35.9 2003 39.3 2004 44.2 Year Y XY x? y? 2000 1 27.6 27.6 761.8 1 056.3 1 288.8 2001 32.5 65.0 2002 3 35.9 107.7 9 2003 4 39.3 157.2 16 1544.5 2004 44.2 221.0 25 1953.6 15 179.5 578.5 55 6 605.0 3.1 Fit the model Y = Bo + B1x + ɛ 3.2 What would you conclude from the results in 3.1? 3.3 Construct a 95% prediction interval for the median sale price in 2005. Interpret your answer 3.4 Calculate the correlation coefficient and interpret the value 3.5 Calculate the coefficient of determination and interpret the value 14 2.

Glencoe Algebra 1, Student Edition, 9780079039897, 0079039898, 2018
18th Edition
ISBN:9780079039897
Author:Carter
Publisher:Carter
Chapter10: Statistics
Section10.4: Distributions Of Data
Problem 19PFA

Related questions
Question
Transcribed Image Text:3. QUESTION
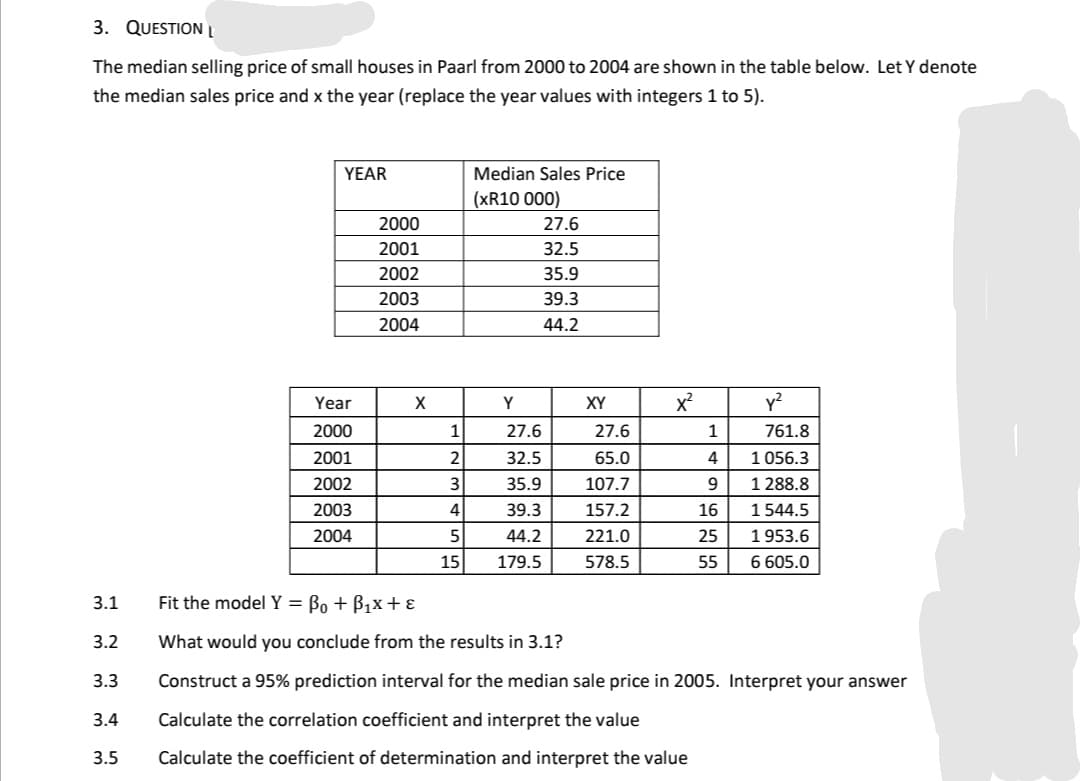
The median selling price of small houses in Paarl from 2000 to 2004 are shown in the table below. Let Y denote
the median sales price and x the year (replace the year values with integers 1 to 5).
YEAR
Median Sales Price
(XR10 000)
2000
27.6
2001
32.5
2002
35.9
2003
39.3
2004
44.2
Year
Y
XY
x
y?
2000
1
27.6
27.6
1
761.8
2001
32.5
65.0
4
1 056.3
2002
3
35.9
107.7
9.
1 288.8
2003
4
39.3
157.2
16
1544.5
2004
44.2
221.0
25
1953.6
15
179.5
578.5
55
6 605.0
3.1
Fit the modelY = Bo + B,x+ɛ
3.2
What would you conclude from the results in 3.1?
3.3
Construct a 95% prediction interval for the median sale price in 2005. Interpret your answer
3.4
Calculate the correlation coefficient and interpret the value
3.5
Calculate the coefficient of determination and interpret the value
Expert Solution
This question has been solved!
Explore an expertly crafted, step-by-step solution for a thorough understanding of key concepts.

Step by step
Solved in 3 steps with 3 images

Recommended textbooks for you
Glencoe Algebra 1, Student Edition, 9780079039897…
Algebra
ISBN:
9780079039897
Author:
Carter
Publisher:
McGraw Hill
Glencoe Algebra 1, Student Edition, 9780079039897…
Algebra
ISBN:
9780079039897
Author:
Carter
Publisher:
McGraw Hill