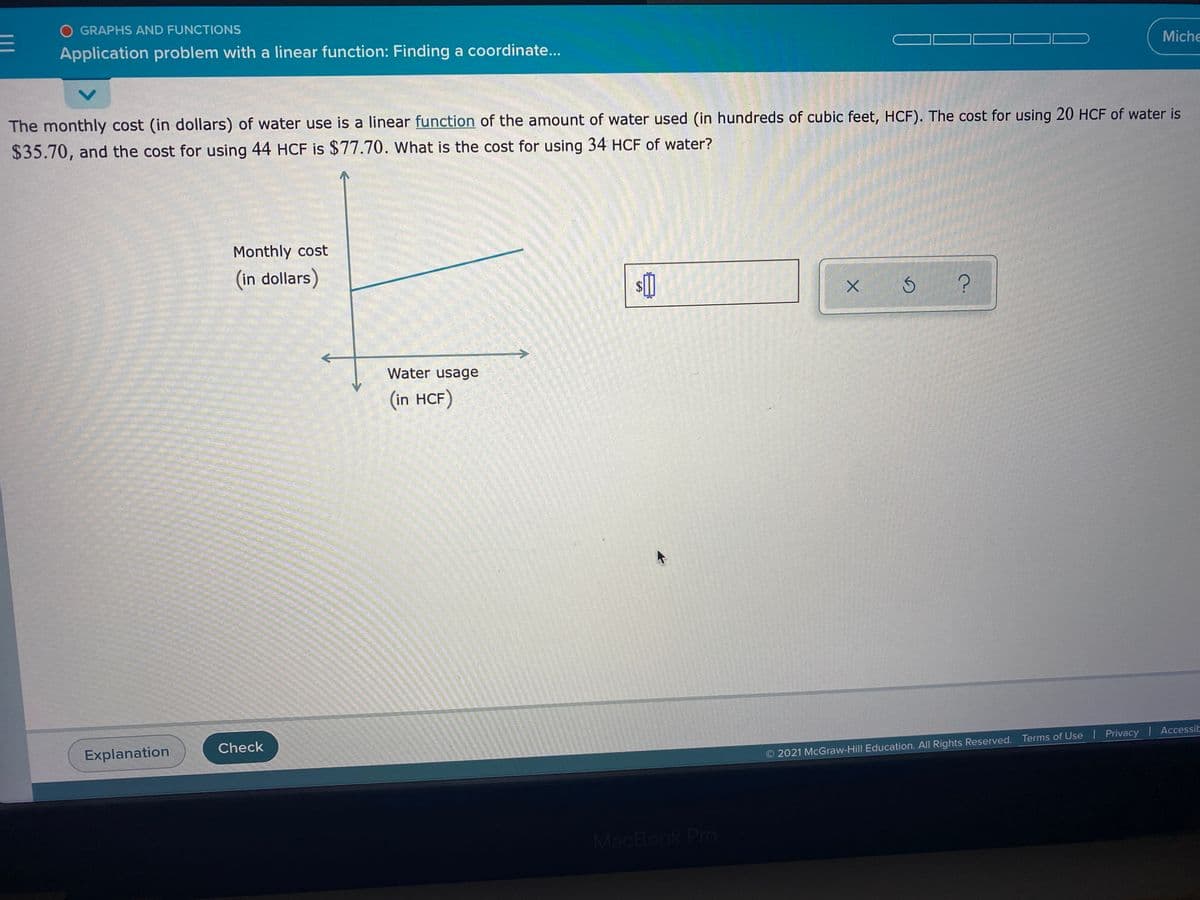
The monthly cost (in dollars) of water use is a linear function of the amount of water used (in hundreds of cubic feet, HCF). The cost for using 20 HCF of water is $35.70, and the cost for using 44 HCF is $77.70. What is the cost for using 34 HCF of water? Monthly cost (in dollars) s[] Water usage (in HCF)
The monthly cost (in dollars) of water use is a linear function of the amount of water used (in hundreds of cubic feet, HCF). The cost for using 20 HCF of water is $35.70, and the cost for using 44 HCF is $77.70. What is the cost for using 34 HCF of water? Monthly cost (in dollars) s[] Water usage (in HCF)

College Algebra (MindTap Course List)
12th Edition
ISBN:9781305652231
Author:R. David Gustafson, Jeff Hughes
Publisher:R. David Gustafson, Jeff Hughes
Chapter2: Functions And Graphs
Section2.3: Linear Functions And Slope
Problem 89E: Rage of decrease The price of computers has been dropping steadily for the past ten years. If a...

Related questions

Concept explainers
Equations and Inequations
Equations and inequalities describe the relationship between two mathematical expressions.
Linear Functions
A linear function can just be a constant, or it can be the constant multiplied with the variable like x or y. If the variables are of the form, x2, x1/2 or y2 it is not linear. The exponent over the variables should always be 1.
Question
Transcribed Image Text:O GRAPHS AND FUNCTIONS
Application problem with a linear function: Finding a coordinate...
Miche
The monthly cost (in dollars) of water use is a linear function of the amount of water used (in hundreds of cubic feet, HCF). The cost for using 20 HCF of water is
$35.70, and the cost for using 44 HCF is $77.70. What is the cost for using 34 HCF of water?
Monthly cost
(in dollars)
Water usage
(in HCF)
Check
Explanation
2021 McGraw-Hill Education. All Rights Reserved. Terms of Use Privacy Accessit
MacBook Pro
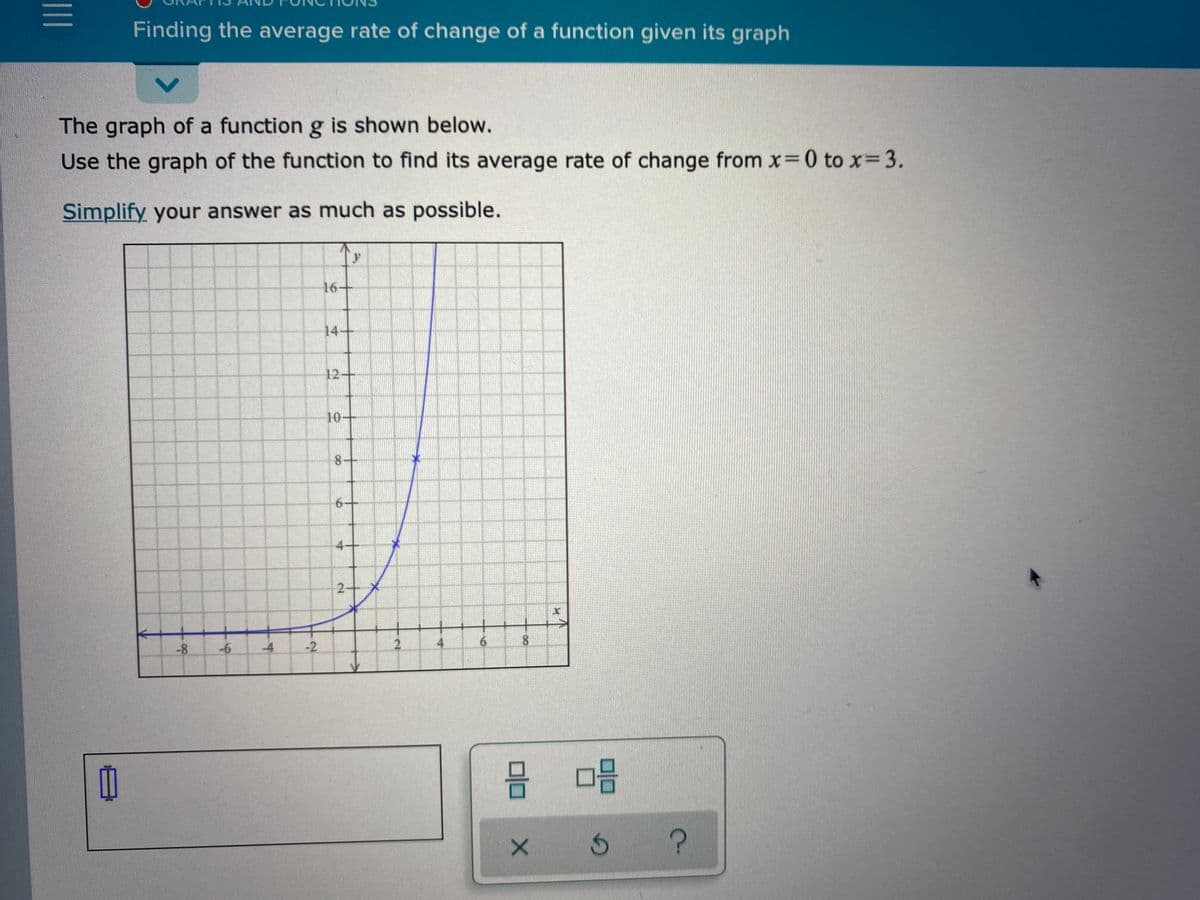
Transcribed Image Text:Finding the average rate of change of a function given its graph
The graph of a function g is shown below.
Use the graph of the function to find its average rate of change from x 0 tox= 3.
Simplify your answer as much as possible.
y
16+
14+
12+
10-
4-
-8
-6
-4
-2
4
8.
믐 미음
6.
2.
Expert Solution
This question has been solved!
Explore an expertly crafted, step-by-step solution for a thorough understanding of key concepts.

This is a popular solution!

Trending now
This is a popular solution!

Step by step
Solved in 3 steps with 3 images

Knowledge Booster


Learn more about
Need a deep-dive on the concept behind this application? Look no further. Learn more about this topic, algebra and related others by exploring similar questions and additional content below.Recommended textbooks for you
College Algebra (MindTap Course List)
Algebra
ISBN:
9781305652231
Author:
R. David Gustafson, Jeff Hughes
Publisher:
Cengage Learning

Algebra and Trigonometry (MindTap Course List)
Algebra
ISBN:
9781305071742
Author:
James Stewart, Lothar Redlin, Saleem Watson
Publisher:
Cengage Learning

Algebra & Trigonometry with Analytic Geometry
Algebra
ISBN:
9781133382119
Author:
Swokowski
Publisher:
Cengage
College Algebra (MindTap Course List)
Algebra
ISBN:
9781305652231
Author:
R. David Gustafson, Jeff Hughes
Publisher:
Cengage Learning
Algebra and Trigonometry (MindTap Course List)
Algebra
ISBN:
9781305071742
Author:
James Stewart, Lothar Redlin, Saleem Watson
Publisher:
Cengage Learning
Algebra & Trigonometry with Analytic Geometry
Algebra
ISBN:
9781133382119
Author:
Swokowski
Publisher:
Cengage

Functions and Change: A Modeling Approach to Coll…
Algebra
ISBN:
9781337111348
Author:
Bruce Crauder, Benny Evans, Alan Noell
Publisher:
Cengage Learning