The motion graphs show a person moving forward for 4.0 s, starting at -9.0 m, traveling to 11.0 m. Complete the following using the information from the above graphs d. Shade the area relating to the displacement on the velocity-time graph. e. Calculate the displacement from this shaded area. Show your calculations below. f. Calculate the acceleration from the velocity-time graph. Show yourcalculations below. Position m 12,9.0F 6.0 Velocity m/s 0.0 -6.0 -9.0 -12.0 10.0 5.0 0.0 -5.0 -10.0 8.1 4.0 0.0
The motion graphs show a person moving forward for 4.0 s, starting at -9.0 m, traveling to 11.0 m. Complete the following using the information from the above graphs d. Shade the area relating to the displacement on the velocity-time graph. e. Calculate the displacement from this shaded area. Show your calculations below. f. Calculate the acceleration from the velocity-time graph. Show yourcalculations below. Position m 12,9.0F 6.0 Velocity m/s 0.0 -6.0 -9.0 -12.0 10.0 5.0 0.0 -5.0 -10.0 8.1 4.0 0.0

Related questions
Question
USE LATEX
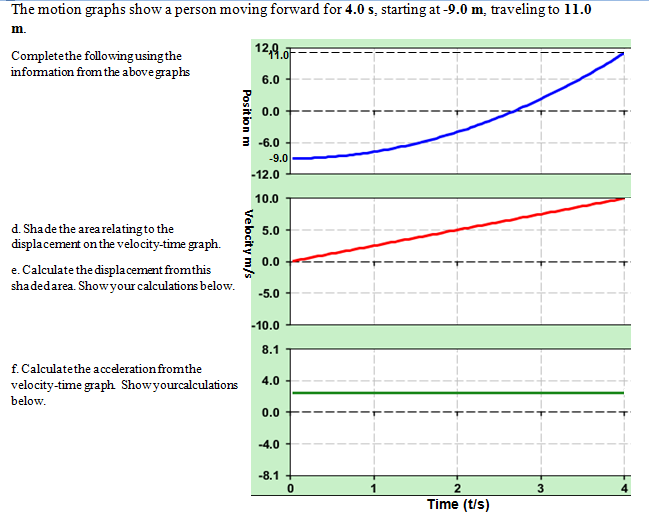
Transcribed Image Text:The motion graphs show a person moving forward for 4.0 s, starting at -9.0 m, traveling to 11.0
m.
Complete the following using the
information from the above graphs
d. Shade the area relating to the
displacement on the velocity-time graph.
e. Calculate the displacement from this
shaded area. Show your calculations below.
f. Calculate the acceleration from the
velocity-time graph Show yourcalculations
below.
Position m
12,9.0
6.0
0.0
3-6.0
Velocity m/s
-9.0
-12.0
10.0
5.0
0.0
-5.0
-10.0
8.1
4.0
0.0
-4.0
-8.1 +
0
2
Time (t/s)
3
Expert Solution
This question has been solved!
Explore an expertly crafted, step-by-step solution for a thorough understanding of key concepts.

Step by step
Solved in 2 steps with 2 images
