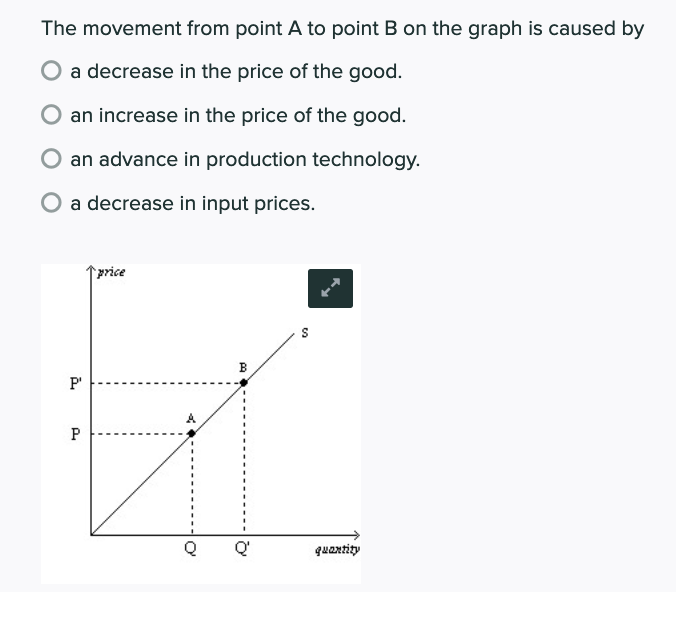
The movement from point A to point B on the graph is caused by O a decrease in the price of the good. an increase in the price of the good. O an advance in production technology. O a decrease in input prices. price B P' Q' quantity P.


Q: An increase in the price of an input will result in for the product. ) decreased demand O increased…
A: According to the law of demand, when there is an increase in the price of a good or service, there…
Q: Price Price Q Quantity Quantity Price Price O Q Quantiry Q & Quantity Which of the above four graphs…
A: When there is a change in the price of goods, then there is a movement along the supply or demand…
Q: 8. The supply of a good refers to A. O Stock available for sale B. O Total stock in the warehouse C.…
A: Supply is represented on the supply schedule which shows various quantities of a commodity that…
Q: (a) On the first graph that follows, show the effect of a shift of the entire supply curve resulting…
A: The shifts in the supply result from the changes in the factors other than the price change. The…
Q: 2. Consider the supply of pizza. If the price of cheese (an input) goes up and the price of hot sub…
A: If there is a commodity that has substitutes available in the market then the increase in price will…
Q: QUESTION 6 An increase in the price of a complement would make the curve shift to the CA supply and…
A: (Since you have asked many questions, we will solve the first one for you. If you want any specific…
Q: Which of the following would cause a shift in the demand curve for notebooks. Select one: O a. A…
A: A shift in demand curve will takes place when price remains constant and other factors affecting…
Q: How are the resource and product markets connected? A change in the product market affects the…
A: Resource market is where businesses purchase their resources in order to produce goods and services.…
Q: The cost of sunflower seeds has increased. Sunflower seeds are an input when sunflowers are…
A: The demand and supply curve together intersects in the market to determine the equilibrium price.…
Q: Daily Times Flood Destroys Midwest. Wheat farmers lose their crops. Based on the event mentioned in…
A: The news is that wheat farmers lost their crops because of floods.
Q: What happens to the supply curve when prices of factor of production rises
A: Prices of factor of production have a huge role to play in the supply of a commodity. It affects the…
Q: 39
A: Supply responds to price fluctuations. Supply and price have a direct relationship. If the price…
Q: The firm tries to maximize the production of P = 12MC. The company reserves a budget of Rp 500 to…
A: Production function shows the functional relationship between the output and input. The condition…
Q: Coffee beans are an input in the production of lattes, and lattes and cookies are complements. A…
A: Complementary goods are such goods that satisfy the demand jointly. The rise in price of one good…
Q: I need help in these questions. I have onl 15 minutes, No explanation needed. just post the answers…
A: The marginal product is the change in the total output when one additional unit of labour is used.…
Q: THIS IS NOT A WRITING ASSIGNMENT! It is a graph. I need help on how to draw the supply and demand…
A: In this case there is no change in the price of avocados but a change in the input that is the price…
Q: Note: Line segments will automatically connect the points. Remember to plot from left to right. ?…
A: The market supply is the sum of all the individual quantities supplied at each price level.
Q: on 3 When the supply curve increases, it shifts and to the down, right O down, left O up, right O…
A: Since you have posted multiple questions, as per answering guidelines, we are supposed to solve only…
Q: You publish a magazine for calculator collectors. To produce and distribute this magazine, you use a…
A: When the price of labor falls then the cost of production falls. This implies firm can increase…
Q: What attracts new sellers into a market? O Fewer sellers in the market than a year previously. O…
A: Before entering the market, firms make market research ahout producers and consumers behavior to get…
Q: In 2002, a meeting is hold in a state-owned farm with one million mu of arable land—B farm after the…
A: Given, A meeting held in a state owned farm with One Million Mu of arable land after harvest
Q: Explain J B Say’s Law of Market
A: Law of market was developed in 1803 by the well known economist J B Say.
Q: Rubber is an input in tires. What will definitely happen if the price of rubber decreases? Demand…
A: Demand curve different combinations of price and quantity demanded and supply curve shows different…
Q: Which is the correct statement Select one: O a. Demand is flow O b. Demand is Stock c. Demand is…
A: In the competitive market, the forces of demand and supply of a good determine the equilibrium price…
Q: nside à workers and computers. Explain wh neans if skilled workers and computers are complements in…
A: Skilled workers and Computers are two inputs and Complement each other to production. Two inputs are…
Q: QUESTION 17 Among the following, which situation would cause a downward movement (and to the left)…
A: Movement along the supply curve occurs only when there is a change in the price of commodity &…
Q: Refer to the accompanying graph. Which event would cause the supply curve to to the right? O a)…
A: Supply curve is upward sloping. Increase in supply is represented by the rightward shift of the…
Q: An economy is producing two goods, chocolate and cookies, and is currently operating effici…
A: We can see the following question.
Q: Input either "increase" or "decrease" where relevant: An increase in the prices of inputs will…
A: Price and supply vary in response to shifts in supply and demand conditions. Equilibrium is…
Q: Price of S3 S1 S2 coconuts A B. E Quantity of coconuts (Figure: Supply of Coconuts) Look at the…
A: Supply Curve: - supply curve is the graphical way of showing the relationship between the quantity…
Q: For each of the following situations relating to the supply of pizza: Identify the factor affecting…
A: find below the answer.
Q: An increase in quantity supplied of a product is due to Select one: O A. an increase in the price of…
A: law of supply states that an increase in the price of a product causes an increase in the quantity…
Q: Tools MC Productive eff Profit maximiz ATC Allocative effi Demand MR Quantity b. In which of these…
A: Profit maximization is where Marginal revenue equals marginal cost. Product efficiency occurs at…
Q: 3. When he prices of materials required in bathtub production increase, what effect (if any) does it…
A: The supply curve refers to the quantity that a producer wishes to sell at a given price in a given…
Q: As prices rise, why will producers increase production of a product? O They are required to by law.…
A: As prices of the product increase, the suppliers will increase the production of the product in…
Q: A В F D Bread Refer to the figure above, an economy is at full employment and then workers in the…
A: Production possibility frontier (PPF) shows the combination of two products or goods which can be…
Q: PartE On the attached graph paper, draw the Supply Curve for the Supply Schedule below. Anton's…
A: The supply curve depicts the producers' point of view, in which the amount they will sell is…
Q: In 2002, a meeting is hold in a state-owned farm with one million mu of arable land—B farm after the…
A: Managerial economics is a branch of economics concerned with the use of economic methods in…
Q: The movement from point A to point B on the graph is caused by O a decrease in the price of the…
A: The demand curve is a graphical representation of demand plans that portrays the different amounts…
Q: Given the scarcity of semiconductors in the production of new cars, what is the effect on the supply…
A: Supply curve shows the positive relationship between the price and quantity supplied of good. It is…
Q: If the price of barley (an input into beer production) falls and at the same time the price of wine…
A: Two goods are substitutes if only one of them is consumed as they satisfy the same need
Q: Suppose f(p) is the number of sandwiches they sell at price p. From the short experience of working…
A: If f(p) represents the quantity of sandwiches sold, it is represents the the quantity of sandwiches…
Q: d) Assume instead there is an increase in the price of tin, a major input in producing gadgets.…
A: The input price would make a direct impact on the supply of a good. An increase in input price will…
Q: When supply curve is upward sloping, its slope is (a) Positive b) Negative (c) First positive then…
A: Any curve, whether supply or demand, has a slope with value more than 0 (positive) if it is upward…
Q: If the cost of lemons falls from $5 to $4 a bag, we could predict the supply curve lemonade would a)…
A: Supply curve has a positive slope. It shows a direct relationship between price and quantity…
Q: Which of the following is the best example of a transactions cost? O the price of labor and…
A: Cost is the expenditure of producing goods and services. It is the sum total of the total fixed cost…
Q: On the next graph, show the effect of a movement along a fixed supply curve that results from an
A: As per ‘law of supply’ with the increase(↑) in price(P) of a good, the quantity(Q) supplied for that…


Trending now
This is a popular solution!

Step by step
Solved in 3 steps

- ANSWER ONLY SUBPART 4 Suppose the economy has 100 units of labor (L) and 100 units of capital (K), and it chooses to allocate three times more labor and capital in the production of good X than in good Y. Suppose also that the production of goods X and Y are represented by the following functions: X = LX0.25KX0.25; Y = 2LY0.25KY0.25. Compute for Lx, Ly, Kx and Ky Calculate the MRTSLK of each firm Is this allocation efficient? How so? How many unit of X and Y will be produced?List and discuss three (3) factors affecting the upward sloping curve.Table 1 Production Function and Demand for Labor Schedules Quantity of labor demanded (billions of hours per year) 0 2 4 Real GDP (billions of 2009 dollars) 00 105105 150150 Real wage rate (2009 dollars per hour) 7575 4545 1515 Table 2 Supply of Labor Schedule Quantity of labor supplied (billions of hours per year) 0 2 4 Real wage rate (2009 dollars per hour) 1515 4545 7575 Use the information in the schedules above to draw this economy's production function. Label it. Draw a point to show equilibrium employment and potential GDP. At the full-employment quantity of labor, the real wage rate is $nothing an hour.
- Economics explain both figures individually and under seperate heading. mention what is happeninh in both the graphs and why there is shift in the curves. how the curves effect the variables mentioned in x and y axis. give a detailed explaination and step wise.How do I graph this? My equilibrium I'm getting P=14 but when I plug that into the equations I'm getting Qs= 21 and Qd= 7.Consider the pizza market in BC. Suppose an innovation in cheese processing technology makes it possible to produce more pizzas at a lower cost than ever before. Holding all other factors constant, What will be the effect of this technology on pizza market. Draw a graph and explain.
- Only typed answer and please don't use chatgpt How does the market for inputs like labor differ from the market for goods and services? (Check all that apply.) Part 2 A. Firms are sellers in the market for goods and services, while individuals are sellers in the market for inputs. B. The demand for inputs is derived from the demand for final goods and services. C. Firms are buyers in the market for inputs, while individuals are buyers in the market for goods and services. D. The market for inputs resolves shortages and surpluses through government-supervised negotiations.Illustrate the appropriate change and specify whethereach change represents an increase or a decrease. e. Ian, a manager at Kiddles Supermarket, decides to forego his vacation to NewYork when he learns that all employees’ salaries will be cut by 5 percent at theend of the month.b. Suppose that prices of some goods increase while prices of other goods remain constant. The cost of living will rise for some consumers and fall for others. Explain whether this statement is true or false.
- i. Explain why AS curve is vertical in the long runii. Some economists believe that AS curve is positively sloped in the short run. Explain 3 theories which justify this view.iii. Explain 4 variables which can shift the AS curve both in the long run and the short run.iv. Is there any variable which shifts AS in the short run , but not in the long run?Draw the diagram of the decreasing LAC curve an increasing LAC curve?Amazon sets a demanding pace on the job Adapted from: Byers, S.M. & Stanberry, K. (2018). Business Ethics. OpenStax. In a visit to an Amazon distribution center, a group of business students and their professors met with the general manager. After taking them on an extensive tour of the five-acre facility, the general manager commented on the slowness of the visitors’ walking pace. He described the Amazon Pace, a fast, aggressive walk, and confirmed that the average employee walks eight or nine miles during a shift. These employees are called “pickers,” and their task is to fill an order and deliver it to the processing and packing center as quickly as possible. The design of the center is a trade secret that results in a random distribution of products. Therefore, the picker has to cover a number of directions and distances while filling an order. Those who cannot keep up the pace are usually let go, just as those who would steal. Does the requirement to walk an average of…

