The net weight (in oz) of a dry bleach product is to be monitored by F and R control charts using a sam- ple size of n = 5. Data for 20 preliminary samples are shown in Table 6E.7. (a) Set up ī and R control charts using these data. Does the process exhibit statistical control? (b) Estimate the process mean and standard deviation. (c) Does fill weight seem to follow a normal distri- bution? (d) If the specifications are at 16.2 ± 0.5, what conclusions would you draw about process capability? (e) What fraction of containers produced by this process is likely to be below the lower specifi- cation limit of 15.7 oz?
The net weight (in oz) of a dry bleach product is to be monitored by F and R control charts using a sam- ple size of n = 5. Data for 20 preliminary samples are shown in Table 6E.7. (a) Set up ī and R control charts using these data. Does the process exhibit statistical control? (b) Estimate the process mean and standard deviation. (c) Does fill weight seem to follow a normal distri- bution? (d) If the specifications are at 16.2 ± 0.5, what conclusions would you draw about process capability? (e) What fraction of containers produced by this process is likely to be below the lower specifi- cation limit of 15.7 oz?

A First Course in Probability (10th Edition)
10th Edition
ISBN:9780134753119
Author:Sheldon Ross
Publisher:Sheldon Ross
Chapter1: Combinatorial Analysis
Section: Chapter Questions
Problem 1.1P: a. How many different 7-place license plates are possible if the first 2 places are for letters and...

Related questions
Question
solve the following problem in excel, show in images (and formulas)
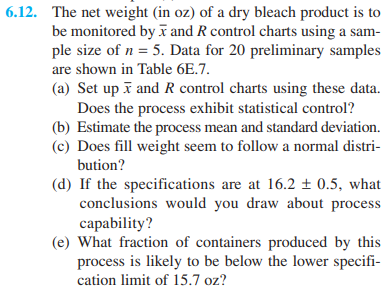
Transcribed Image Text:6.12. The net weight (in oz) of a dry bleach product is to
be monitored by ī and R control charts using a sam-
ple size of n = 5. Data for 20 preliminary samples
are shown in Table 6E.7.
(a) Set up ī and R control charts using these data.
Does the process exhibit statistical control?
(b) Estimate the process mean and standard deviation.
(c) Does fill weight seem to follow a normal distri-
bution?
(d) If the specifications are at 16.2 ± 0.5, what
conclusions would you draw about process
capability?
(e) What fraction of containers produced by this
process is likely to be below the lower specifi-
cation limit of 15.7 oz?
Expert Solution
This question has been solved!
Explore an expertly crafted, step-by-step solution for a thorough understanding of key concepts.

This is a popular solution!

Trending now
This is a popular solution!

Step by step
Solved in 2 steps with 19 images

Recommended textbooks for you
A First Course in Probability (10th Edition)
Probability
ISBN:
9780134753119
Author:
Sheldon Ross
Publisher:
PEARSON

A First Course in Probability (10th Edition)
Probability
ISBN:
9780134753119
Author:
Sheldon Ross
Publisher:
PEARSON