The next seven questions refer to the following scenario: A random sample of 16 Porsche drivers yielded an average age of 50 years with a variance of 9 years and a random sample of also 16 Ferrari drivers yielded an average of 47 years with a variance of 25 years. Porsche Driver Ferrari Driver 16 16 mean 50 47 Variance 9. 25 Conduct the following hypothesis test at a=0.05. HO: Mean Age Porsche Drivers< Mean Age Ferrari Drivers HA: Mean Age Porsche Drivers > Mean Age Ferrari Drivers Assume unequal variance.
The next seven questions refer to the following scenario: A random sample of 16 Porsche drivers yielded an average age of 50 years with a variance of 9 years and a random sample of also 16 Ferrari drivers yielded an average of 47 years with a variance of 25 years. Porsche Driver Ferrari Driver 16 16 mean 50 47 Variance 9. 25 Conduct the following hypothesis test at a=0.05. HO: Mean Age Porsche Drivers< Mean Age Ferrari Drivers HA: Mean Age Porsche Drivers > Mean Age Ferrari Drivers Assume unequal variance.

Chapter1: Equations, Inequalities, And Mathematical Modeling
Section1.3: Modeling With Linear Equations
Problem 61E

Related questions
Question
Please answer the question contained in the following picture

Transcribed Image Text:How many degrees do you have for your hypothesis test? df=
O 22
23
24
25
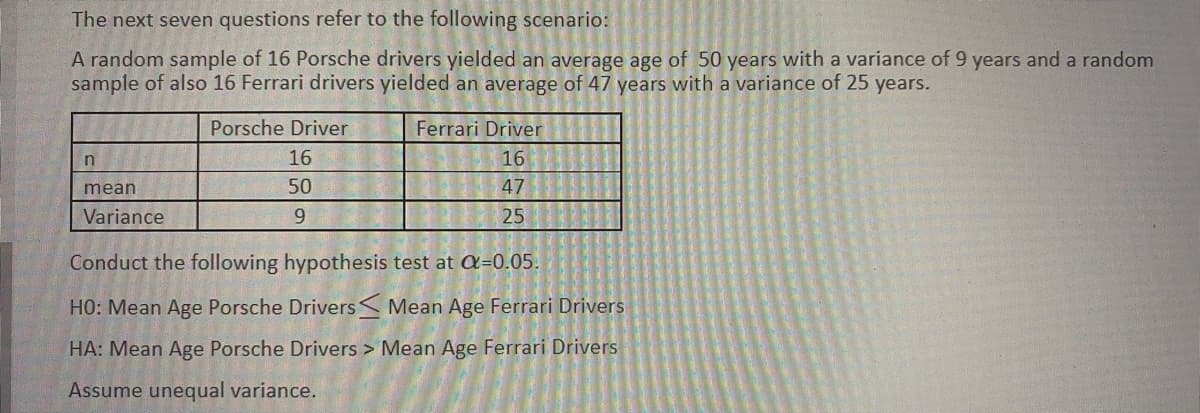
Transcribed Image Text:The next seven questions refer to the following scenario:
A random sample of 16 Porsche drivers yielded an average age of 50 years with a variance of 9 years and a random
sample of also 16 Ferrari drivers yielded an average of 47 years with a variance of 25 years.
Porsche Driver
Ferrari Driver
16
16
mean
50
47
Variance
25
Conduct the following hypothesis test at C=0.05.
HO: Mean Age Porsche Drivers< Mean Age Ferrari Drivers
HA: Mean Age Porsche Drivers > Mean Age Ferrari Drivers
Assume unequal variance.
Expert Solution
This question has been solved!
Explore an expertly crafted, step-by-step solution for a thorough understanding of key concepts.

Step by step
Solved in 2 steps

Recommended textbooks for you

Algebra & Trigonometry with Analytic Geometry
Algebra
ISBN:
9781133382119
Author:
Swokowski
Publisher:
Cengage
Algebra & Trigonometry with Analytic Geometry
Algebra
ISBN:
9781133382119
Author:
Swokowski
Publisher:
Cengage