The next test is a t-test for unequal variance. Here is the problem: The human resources department at Sue, Grabitt, and Runne also tracks the cost of one-bedroom apartments in two popular neighborhoods, NoBo and SoBo. The general perception of long-time residents is that rents are probably lower in SoBo. They hope to determine whether the average rent for a one-bedroom apartment is lower in SoBo than in NoBo.


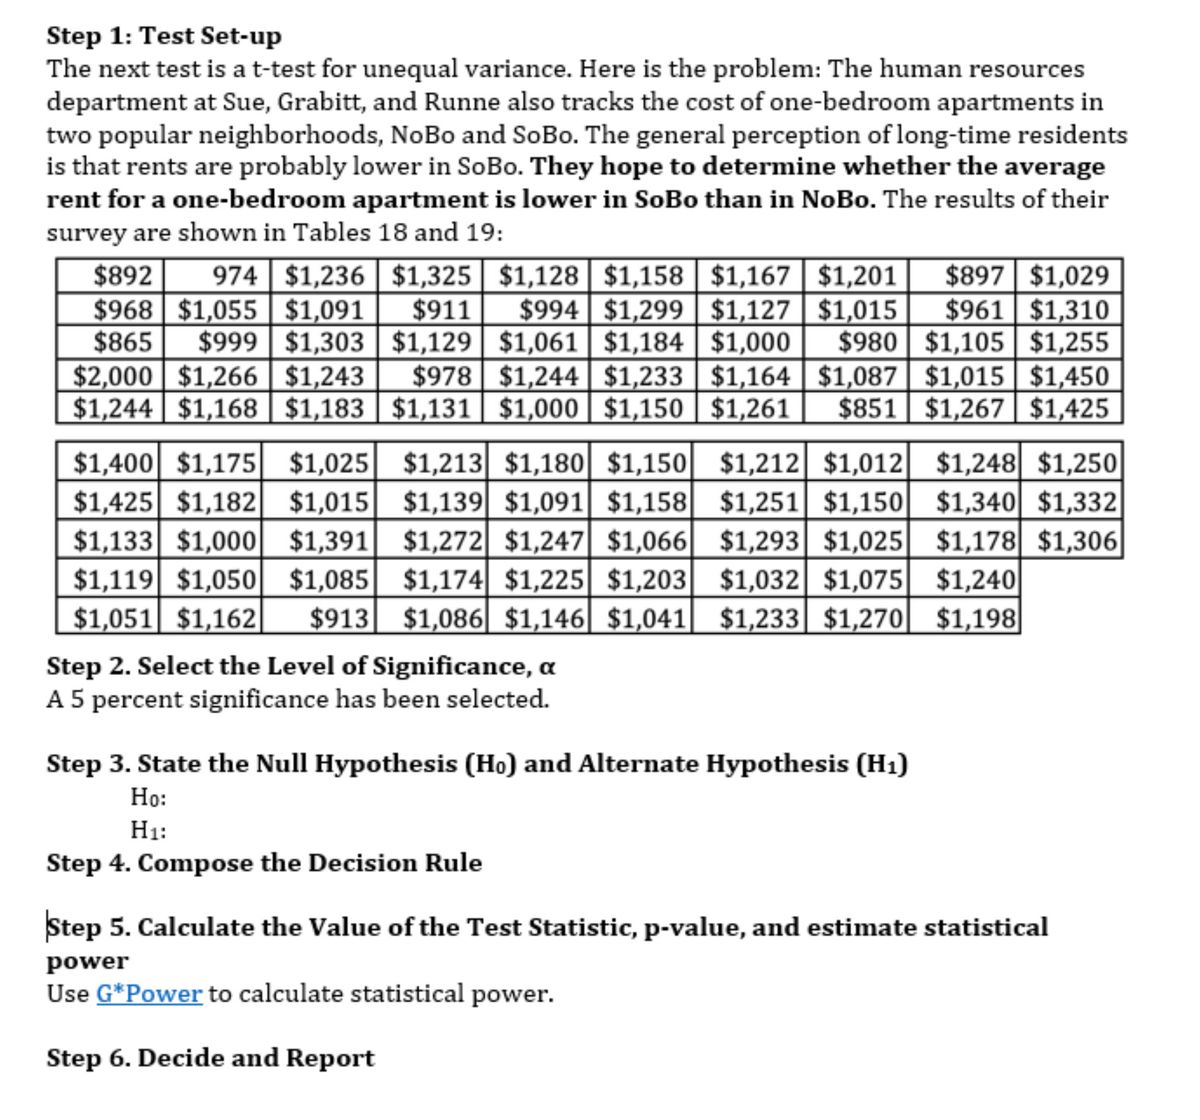
The next test is a t-test for unequal variance. Here is the problem: The human resources department at Sue, Grabitt, and Runne also tracks the cost of one-bedroom apartments in two popular neighborhoods, NoBo and SoBo. The general perception of long-time residents is that rents are probably lower in SoBo. They hope to determine whether the average rent for a one-bedroom apartment is lower in SoBo than in NoBo. The results of their survey are shown in Tables 18 and 19:
Step 2. Select the Level of Significance, α
A 5 percent significance has been selected.
Step 3. State the Null Hypothesis (H0) and Alternate Hypothesis (H1)
H0:
H1:
Step 4. Compose the Decision Rule
Step 5. Calculate the Value of the Test Statistic, p-value, and estimate statistical power
Use G*Power to calculate statistical power


Trending now
This is a popular solution!

Step by step
Solved in 2 steps


