The number and frequency of a certain ocean's hurricanes annually from 1940 through 2015 is shown below This means, for instance, that no hurricanes occurred during 5 of these years, only one hurricane occurred in 14 of these years, and so on Complete parts a through c below 0 1 2 3 4 5 6 7 8 11 12O Frequency 5 14 20 16 3 5 5 3 2 1 1 Number a. Find the probabilities of 0-12 hurricanes each season using these data Number 3 6 8 11 12 Frequency 14 20 16 3 3 2 1 Probability 067 187 267 213 040 067 067 040 0 027 013 013 (Type integers or decimals rounded to three decimal places as needed.) b. Find the mean number of hurricanes mean = 3.053 (Type an integer or decimal rounded to three decimal places as needed) c. Assuming a Poisson distribution and using the mean number of hurricanes per season from part b, compute the probabilitiep of experiencing 0-12 hurricanes in a season. Compare these to your answer to part a How accurately does a Poison distribution model this phenomenon? Construct a chart to visualize these results Start by computing the probabilities assuming a Poisson distribution Number 2 3. 4. 11 12 Frequency 14 20 16 3 1 Poisson Probability (Type integers or decimals rounded to three decimal places as needed.)
The number and frequency of a certain ocean's hurricanes annually from 1940 through 2015 is shown below This means, for instance, that no hurricanes occurred during 5 of these years, only one hurricane occurred in 14 of these years, and so on Complete parts a through c below 0 1 2 3 4 5 6 7 8 11 12O Frequency 5 14 20 16 3 5 5 3 2 1 1 Number a. Find the probabilities of 0-12 hurricanes each season using these data Number 3 6 8 11 12 Frequency 14 20 16 3 3 2 1 Probability 067 187 267 213 040 067 067 040 0 027 013 013 (Type integers or decimals rounded to three decimal places as needed.) b. Find the mean number of hurricanes mean = 3.053 (Type an integer or decimal rounded to three decimal places as needed) c. Assuming a Poisson distribution and using the mean number of hurricanes per season from part b, compute the probabilitiep of experiencing 0-12 hurricanes in a season. Compare these to your answer to part a How accurately does a Poison distribution model this phenomenon? Construct a chart to visualize these results Start by computing the probabilities assuming a Poisson distribution Number 2 3. 4. 11 12 Frequency 14 20 16 3 1 Poisson Probability (Type integers or decimals rounded to three decimal places as needed.)

Algebra & Trigonometry with Analytic Geometry
13th Edition
ISBN:9781133382119
Author:Swokowski
Publisher:Swokowski
Chapter10: Sequences, Series, And Probability
Section10.8: Probability
Problem 29E

Related questions
Question
11c) see picture solve for c
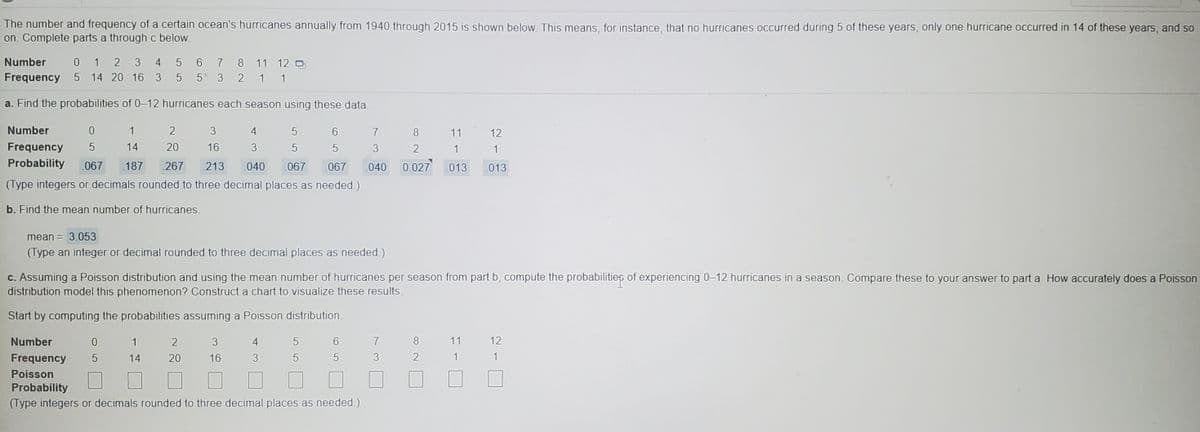
Transcribed Image Text:The number and frequency of a certain ocean's hurricanes annually from 1940 through 2015 is shown below. This means, for instance, that no hurricanes occurred during 5 of these years, only one hurricane occurred in 14 of these years, and so
on. Complete parts a through c below.
Number
0 1 2 3 4
5 6 7 8 11 12 O
Frequency 5 14 20 16 3
5 5 3
1 1
a. Find the probabilities of 0-12 hurricanes each season using these data.
Number
1
4
6.
7
8.
11
12
Frequency
14
20
16
3
3.
2
1
1
Probability
.067
187
.267
213
.040
.067
067
040
0.027
013
013
(Type integers or decimals rounded to three decimal places as needed.)
b. Find the mean number of hurricanes.
mean = 3.053
(Type an integer or decimal rounded to three decimal places as needed.)
c. Assuming a Poisson distribution and using the mean number of hurricanes per season from part b, compute the probabilities of experiencing 0-12 hurricanes in a season. Compare these to your answer to part a How accurately does a Poisson
distribution model this phenomenon? Construct a chart to visualize these results.
Start by computing the probabilities assuming a Poisson distribution.
Number
1
4
6.
8.
11
12
Frequency
5
14
20
16
3
3.
1
1
Poisson
Probability
(Type integers or decimals rounded to three decimal places as needed.)
Expert Solution
Step 1
Since you have posted a question with multiple sub-parts and requested to solve part c, we will solve sub-
part c for you.
Let X be the number of hurricanes.
Mean=3.053
Poisson distribution:
A r.v X is said to have Poisson distribution if its pdf is given by

Trending now
This is a popular solution!

Step by step
Solved in 2 steps with 1 images

Knowledge Booster


Learn more about
Need a deep-dive on the concept behind this application? Look no further. Learn more about this topic, statistics and related others by exploring similar questions and additional content below.Recommended textbooks for you
Algebra & Trigonometry with Analytic Geometry
Algebra
ISBN:
9781133382119
Author:
Swokowski
Publisher:
Cengage
Algebra & Trigonometry with Analytic Geometry
Algebra
ISBN:
9781133382119
Author:
Swokowski
Publisher:
Cengage