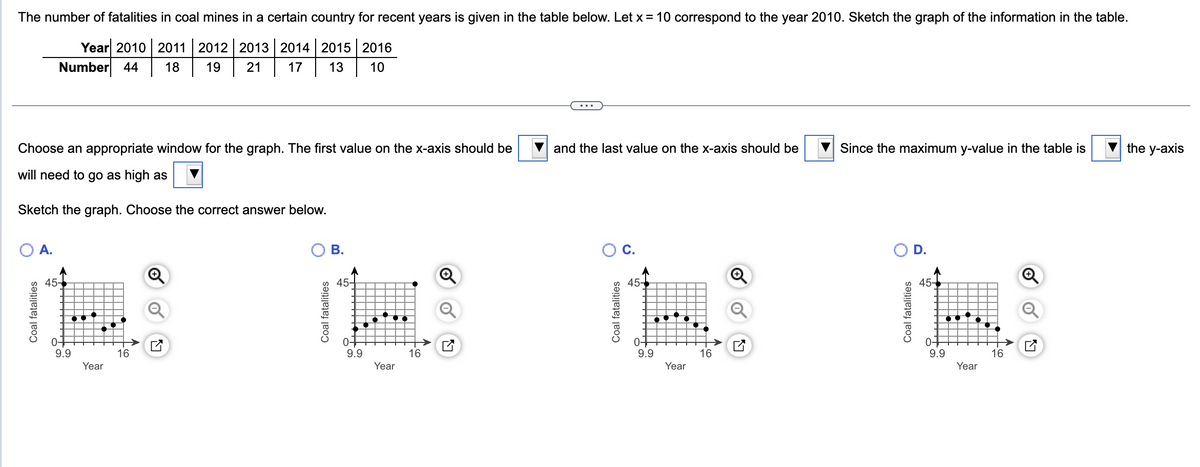
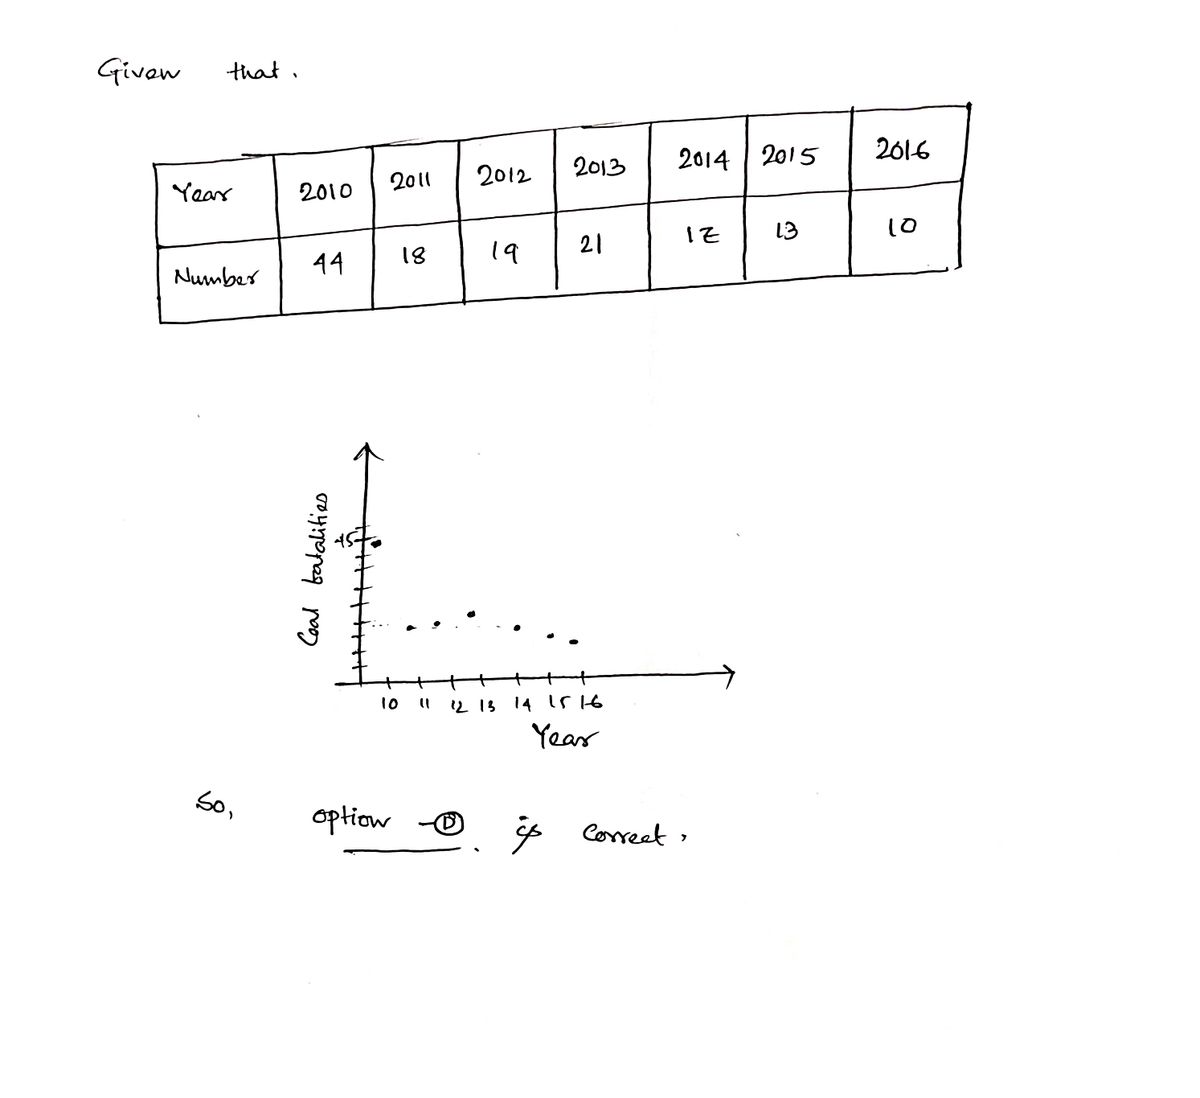
The number of fatalities in coal mines in a certain country for recent years is given in the table below. Let x = 10 correspond to the year 2010. Sketch the graph of the information in the table. Year 2010 2011 2012 2013 2014 2015 2016 Number 44 18 19 21 17 13 10 Choose an appropriate window for the graph. The first value on the x-axis should be will need to go as high as Sketch the graph. Choose the correct answer below. O A. 45- 9.9 Year 16 Q O B. Coal fatalities 45- 0+ 9.9 Year 16 Q C・・・ and the last value on the x-axis should be O C. 45 0- 9.9 Year 16 Q Since the maximum y-value in the table is OD. 45- 9.9 Year 16 Q the y-axis
The number of fatalities in coal mines in a certain country for recent years is given in the table below. Let x = 10 correspond to the year 2010. Sketch the graph of the information in the table. Year 2010 2011 2012 2013 2014 2015 2016 Number 44 18 19 21 17 13 10 Choose an appropriate window for the graph. The first value on the x-axis should be will need to go as high as Sketch the graph. Choose the correct answer below. O A. 45- 9.9 Year 16 Q O B. Coal fatalities 45- 0+ 9.9 Year 16 Q C・・・ and the last value on the x-axis should be O C. 45 0- 9.9 Year 16 Q Since the maximum y-value in the table is OD. 45- 9.9 Year 16 Q the y-axis

Glencoe Algebra 1, Student Edition, 9780079039897, 0079039898, 2018
18th Edition
ISBN:9780079039897
Author:Carter
Publisher:Carter
Chapter10: Statistics
Section10.2: Representing Data
Problem 14PPS

Related questions
Question
Transcribed Image Text:The number of fatalities in coal mines in a certain country for recent years is given in the table below. Let x = 10 correspond to the year 2010. Sketch the graph of the information in the table.
Year 2010 2011 2012 2013 2014 2015 2016
Number 44
18 19 21
17 13 10
Choose an appropriate window for the graph. The first value on the x-axis should be
will need to go as high as
Sketch the graph. Choose the correct answer below.
Coal fatalities
A.
45-
0-
9.9
Year
16
Coal fatalities
B.
45-
9.9
Year
16
and the last value on the x-axis should be
O C.
Coal fatalities
45-
0-
9.9
||
||
Year
16
Ly
Since the maximum y-value in the table is
O D.
Coal fatalities
45-
0-
9.9
Year
16
the y-axis
Expert Solution
Step 1

Trending now
This is a popular solution!

Step by step
Solved in 2 steps with 1 images

Recommended textbooks for you
Glencoe Algebra 1, Student Edition, 9780079039897…
Algebra
ISBN:
9780079039897
Author:
Carter
Publisher:
McGraw Hill

Trigonometry (MindTap Course List)
Trigonometry
ISBN:
9781305652224
Author:
Charles P. McKeague, Mark D. Turner
Publisher:
Cengage Learning

Algebra: Structure And Method, Book 1
Algebra
ISBN:
9780395977224
Author:
Richard G. Brown, Mary P. Dolciani, Robert H. Sorgenfrey, William L. Cole
Publisher:
McDougal Littell
Glencoe Algebra 1, Student Edition, 9780079039897…
Algebra
ISBN:
9780079039897
Author:
Carter
Publisher:
McGraw Hill
Trigonometry (MindTap Course List)
Trigonometry
ISBN:
9781305652224
Author:
Charles P. McKeague, Mark D. Turner
Publisher:
Cengage Learning
Algebra: Structure And Method, Book 1
Algebra
ISBN:
9780395977224
Author:
Richard G. Brown, Mary P. Dolciani, Robert H. Sorgenfrey, William L. Cole
Publisher:
McDougal Littell


College Algebra (MindTap Course List)
Algebra
ISBN:
9781305652231
Author:
R. David Gustafson, Jeff Hughes
Publisher:
Cengage Learning

Algebra & Trigonometry with Analytic Geometry
Algebra
ISBN:
9781133382119
Author:
Swokowski
Publisher:
Cengage