The number of light bulbs that can be expected to last less than 1540 hr is.

Glencoe Algebra 1, Student Edition, 9780079039897, 0079039898, 2018
18th Edition
ISBN:9780079039897
Author:Carter
Publisher:Carter
Chapter10: Statistics
Section10.5: Comparing Sets Of Data
Problem 13PPS

Related questions
Question
help solve
Transcribed Image Text:□
Area
x-μ
0
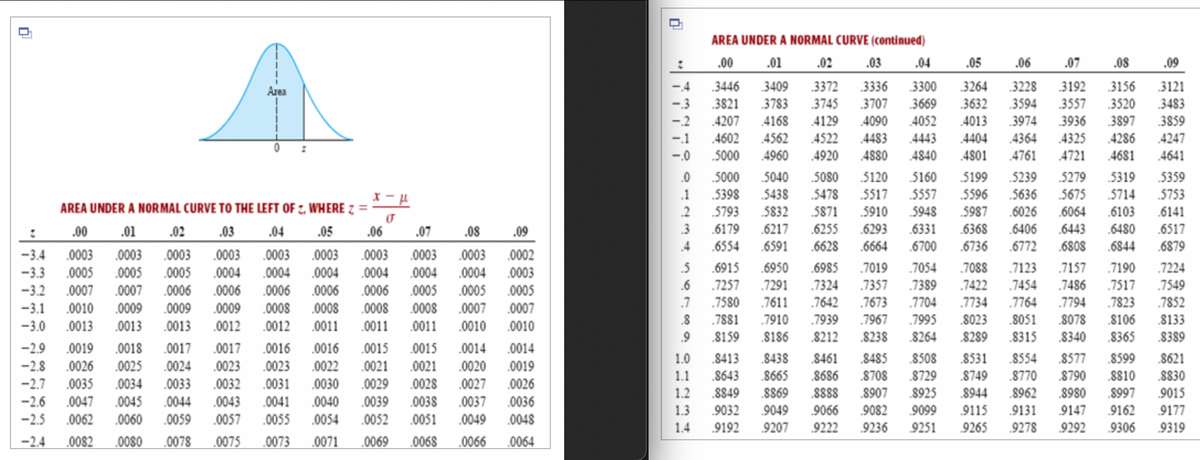
AREA UNDER A NORMAL CURVE TO THE LEFT OF Z, WHERE Z =
.00 .01
.05
.07
.08
.02 .03
.0003 .0003
.0005 .0005 .0004
.0006
-3.2
.0006
-3.1 .0010 .0009 .0009 .0009 .0008
-3.0 .0013 .0013 .0013 .0012 .0012
-3.4 .0003 .0003
.0005
-3.3
.0007 .0007 .0006
.04
.0003 .0003 .0003 .0003 .0003
.0004
.0004
.0004 .0004 .0004
0006 .0005 .0005
.0006
.0008 0008 0008 .0007
0011 0011 0011 .0010
.06
.09
.0002
.0003
.0005
0007
.0010
-2.9 .0019 .0018 .0017 .0017 .0016 .0016 0015 .0015 .0014 0014
-2.8 .0026 .0025 .0024 .0023 .0023 .0022 .0021 0021
.0020 .0019
-2.7 0035 0034 0033 .0032 .0031 .0030 .0029 .0028 .0027 .0026
-2.6 .0047 .0045 .0044 .0043 .0041 .0040 .0039
0038 0037 .0036
-2.5 .0062 .0060 .0059 .0057 .0055
.0054 .0052 0051 .0049 .0048
.0082 .0080 .0078 0075 .0073 .0071 .0069 0068 .0066 .0064
-2.4
AREA UNDER A NORMAL CURVE (continued)
.00 .01 .02 .03 .04
.05
.06 .07 .08 .09
-.4 .3446 3409 3372 3336
3300 3264 3228 3192 .3156 .3121
-.3 .3821 3783 3745 3707 3669 3632 3594 3557
3520 3483
-.2 4207 4168 4129 4090 4052 4013 3974 .3936 3897 3859
4602 4562 4522 4483 4443 4404 4364 4325 4286 4247
.5000 4960 4920 4880 4840 4801 4761 4721 4681 4641
5000 5040 5080 5120 5160 5199 5239 5279 5319 5359
5398 5438 5478 .5517 5557 5596 5636 .5675 .5714 5753
5793 5832 5871 5910 5948
5987 .6026 .6064 .6103
.6141
.6179 .6217 .6255 .6293 .6331 .6368 .6406 .6443 .6480 .6517
.6554 .6591 .6628 .6664 .6700 .6736 .6772 .6808 .6844 .6879
.6950 .6985 .7019 .7054 7088 .7123
.6915
.7190
.7157
.7257
.7291
.7324 7357 .7389 7422 7454 .7486 .7517
.7 .7580
.7611 .7642
.7673 .7704 7734 .7764 .7794 .7823
.7881 .7910 .7939
7967
.7995 .8023 .8051 .8078 .8106
.9 .8159 .8186 .8212 8238
.8264
.8365
1.0 .8413 .8438 .8461 .8485
8508
1.1 .8643 .8665 .8686 8708 8729
1.2 .8849 .8869 8888
.8907 .8925
1.3 .9032 9049 9066 9082 .9099
1.4 .9192 9207 .9222 9236
9251
.8
.8289 .8315 .8340
.8531 .8554 .8577 8599
8749 .8770
.8790 .8810
.8944 8962
.8980 .8997
9115 9131 9147 9162
.9265 .9278 9292
9306
-.0
.0
.1
.2
درا -
.3
.4
567
.5
.6
7224
7549
.7852
8133
.8389
.8621
.8830
.9015
9177
9319
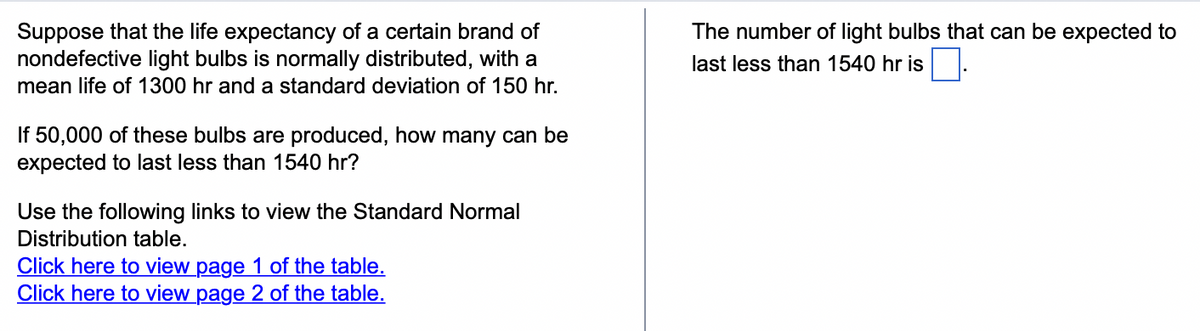
Transcribed Image Text:Suppose that the life expectancy of a certain brand of
nondefective light bulbs is normally distributed, with a
mean life of 1300 hr and a standard deviation of 150 hr.
If 50,000 of these bulbs are produced, how many can be
expected to last less than 1540 hr?
Use the following links to view the Standard Normal
Distribution table.
Click here to view page 1 of the table.
Click here to view page 2 of the table.
The number of light bulbs that can be expected to
last less than 1540 hr is ■.
Expert Solution
This question has been solved!
Explore an expertly crafted, step-by-step solution for a thorough understanding of key concepts.

Step by step
Solved in 3 steps with 1 images

Recommended textbooks for you
Glencoe Algebra 1, Student Edition, 9780079039897…
Algebra
ISBN:
9780079039897
Author:
Carter
Publisher:
McGraw Hill
Glencoe Algebra 1, Student Edition, 9780079039897…
Algebra
ISBN:
9780079039897
Author:
Carter
Publisher:
McGraw Hill