The number of students at one campus who had a 4.0 GPA is shown below, organized by class. Draw a pie cha k a the data. Rank Frequency Freshman 19 Sophomore 25 Junior 40 Senlor 16
The number of students at one campus who had a 4.0 GPA is shown below, organized by class. Draw a pie cha k a the data. Rank Frequency Freshman 19 Sophomore 25 Junior 40 Senlor 16

Glencoe Algebra 1, Student Edition, 9780079039897, 0079039898, 2018
18th Edition
ISBN:9780079039897
Author:Carter
Publisher:Carter
Chapter10: Statistics
Section10.3: Measures Of Spread
Problem 21PFA

Related questions
Question
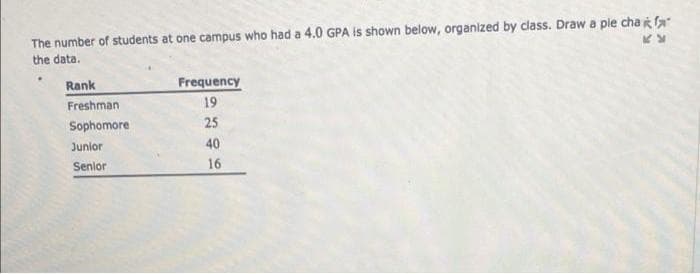
Transcribed Image Text:The number of students at one campus who had a 4.0 GPA is shown below, organized by class. Draw a pie cha fa
the data.
Rank
Frequency
Freshman
19
Sophomore
25
Junior
40
Senlor
16
Expert Solution
This question has been solved!
Explore an expertly crafted, step-by-step solution for a thorough understanding of key concepts.

This is a popular solution!

Trending now
This is a popular solution!

Step by step
Solved in 2 steps with 2 images

Recommended textbooks for you
Glencoe Algebra 1, Student Edition, 9780079039897…
Algebra
ISBN:
9780079039897
Author:
Carter
Publisher:
McGraw Hill
Glencoe Algebra 1, Student Edition, 9780079039897…
Algebra
ISBN:
9780079039897
Author:
Carter
Publisher:
McGraw Hill